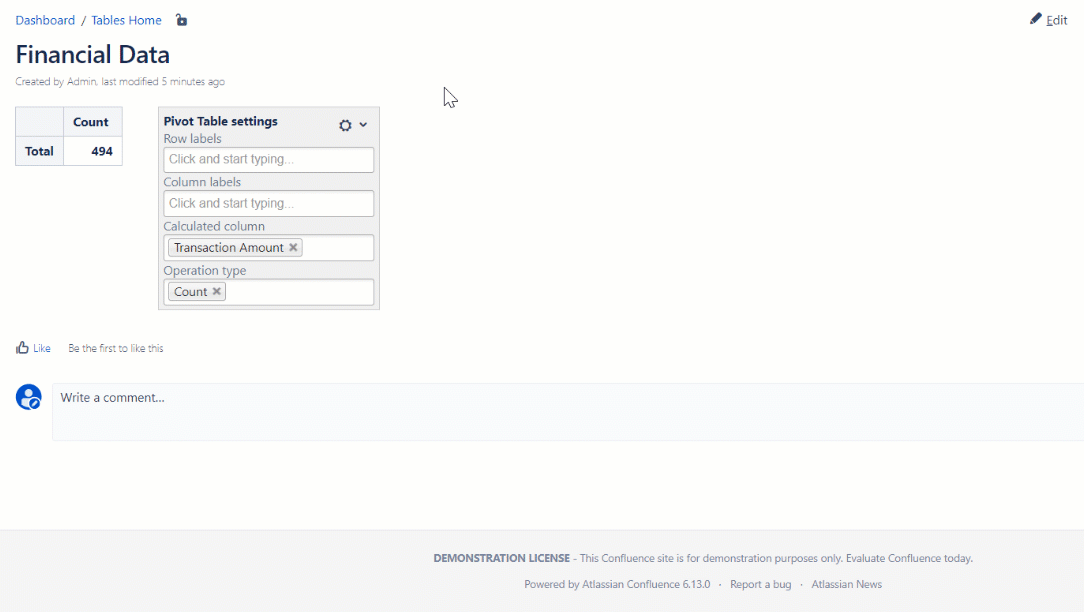
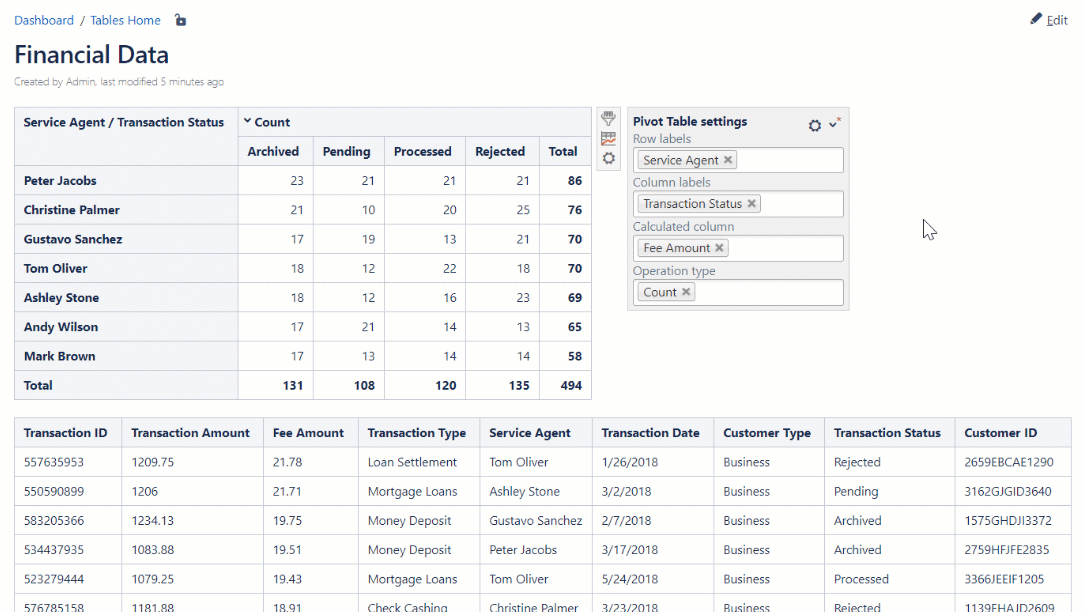
Step 1. Add the macro to your table. Choose the handy way to do this:
Step 2. Select columns for calculation and aggregation:
Read more:
Step 3. Select the appropriate operation type:
Build various charts based on your table
- Gantt chart type
- Pie and Donut chart types
- Bubble Pie chart type
- Column, Stacked Column, Bar, Stacked Bar chart types
- Line, Area, Stacked Area chart types
- Time Line, Time Area, Stacked Time Area chart types
- Radar (Spider) chart type
- Contiguity / Barcode chart (use case)
- Scatter plot (use case)
- Punchcard (use case)
- Comparison of Chart macro against Chart from Table macro
Combine all the macros with each other and with built-in and third-party macros
- Using Table Filter and Charts in Combination with the Jira Issues Macro
- Using Table Filter and Charts in Combination with the Awesome Graphs' Export to CSV
- How to use the app with the Page Properties Report macro
- How to use the app with the Office Excel macro
- How to use the app with the ConfiForms app
- How to use the app with the Advanced Tables app