Download PDF
Download page Line, Area, Stacked Area chart types.
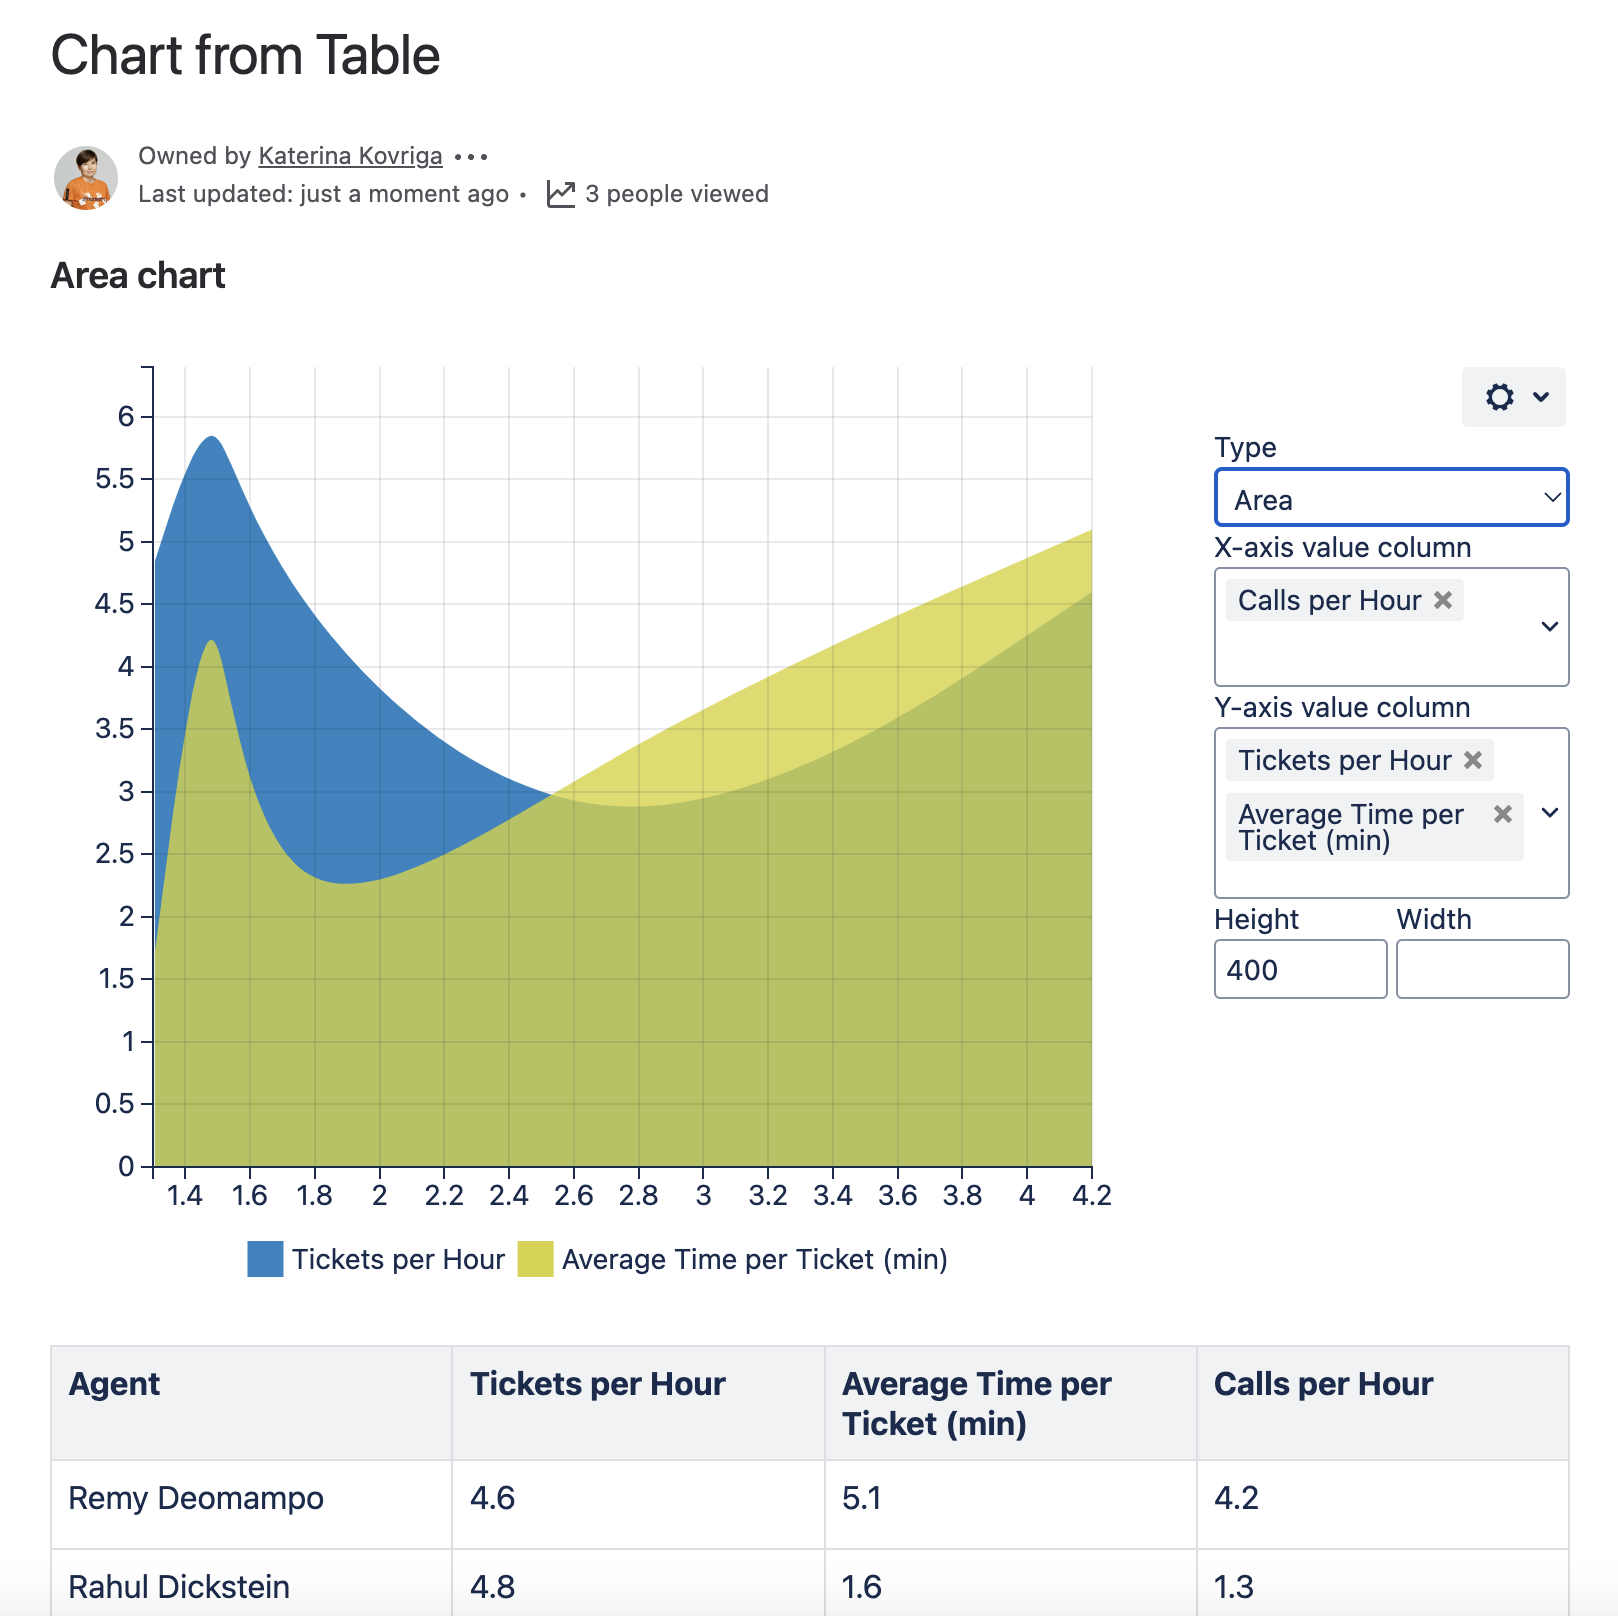
Line, Area, Stacked Area chart types
Overview
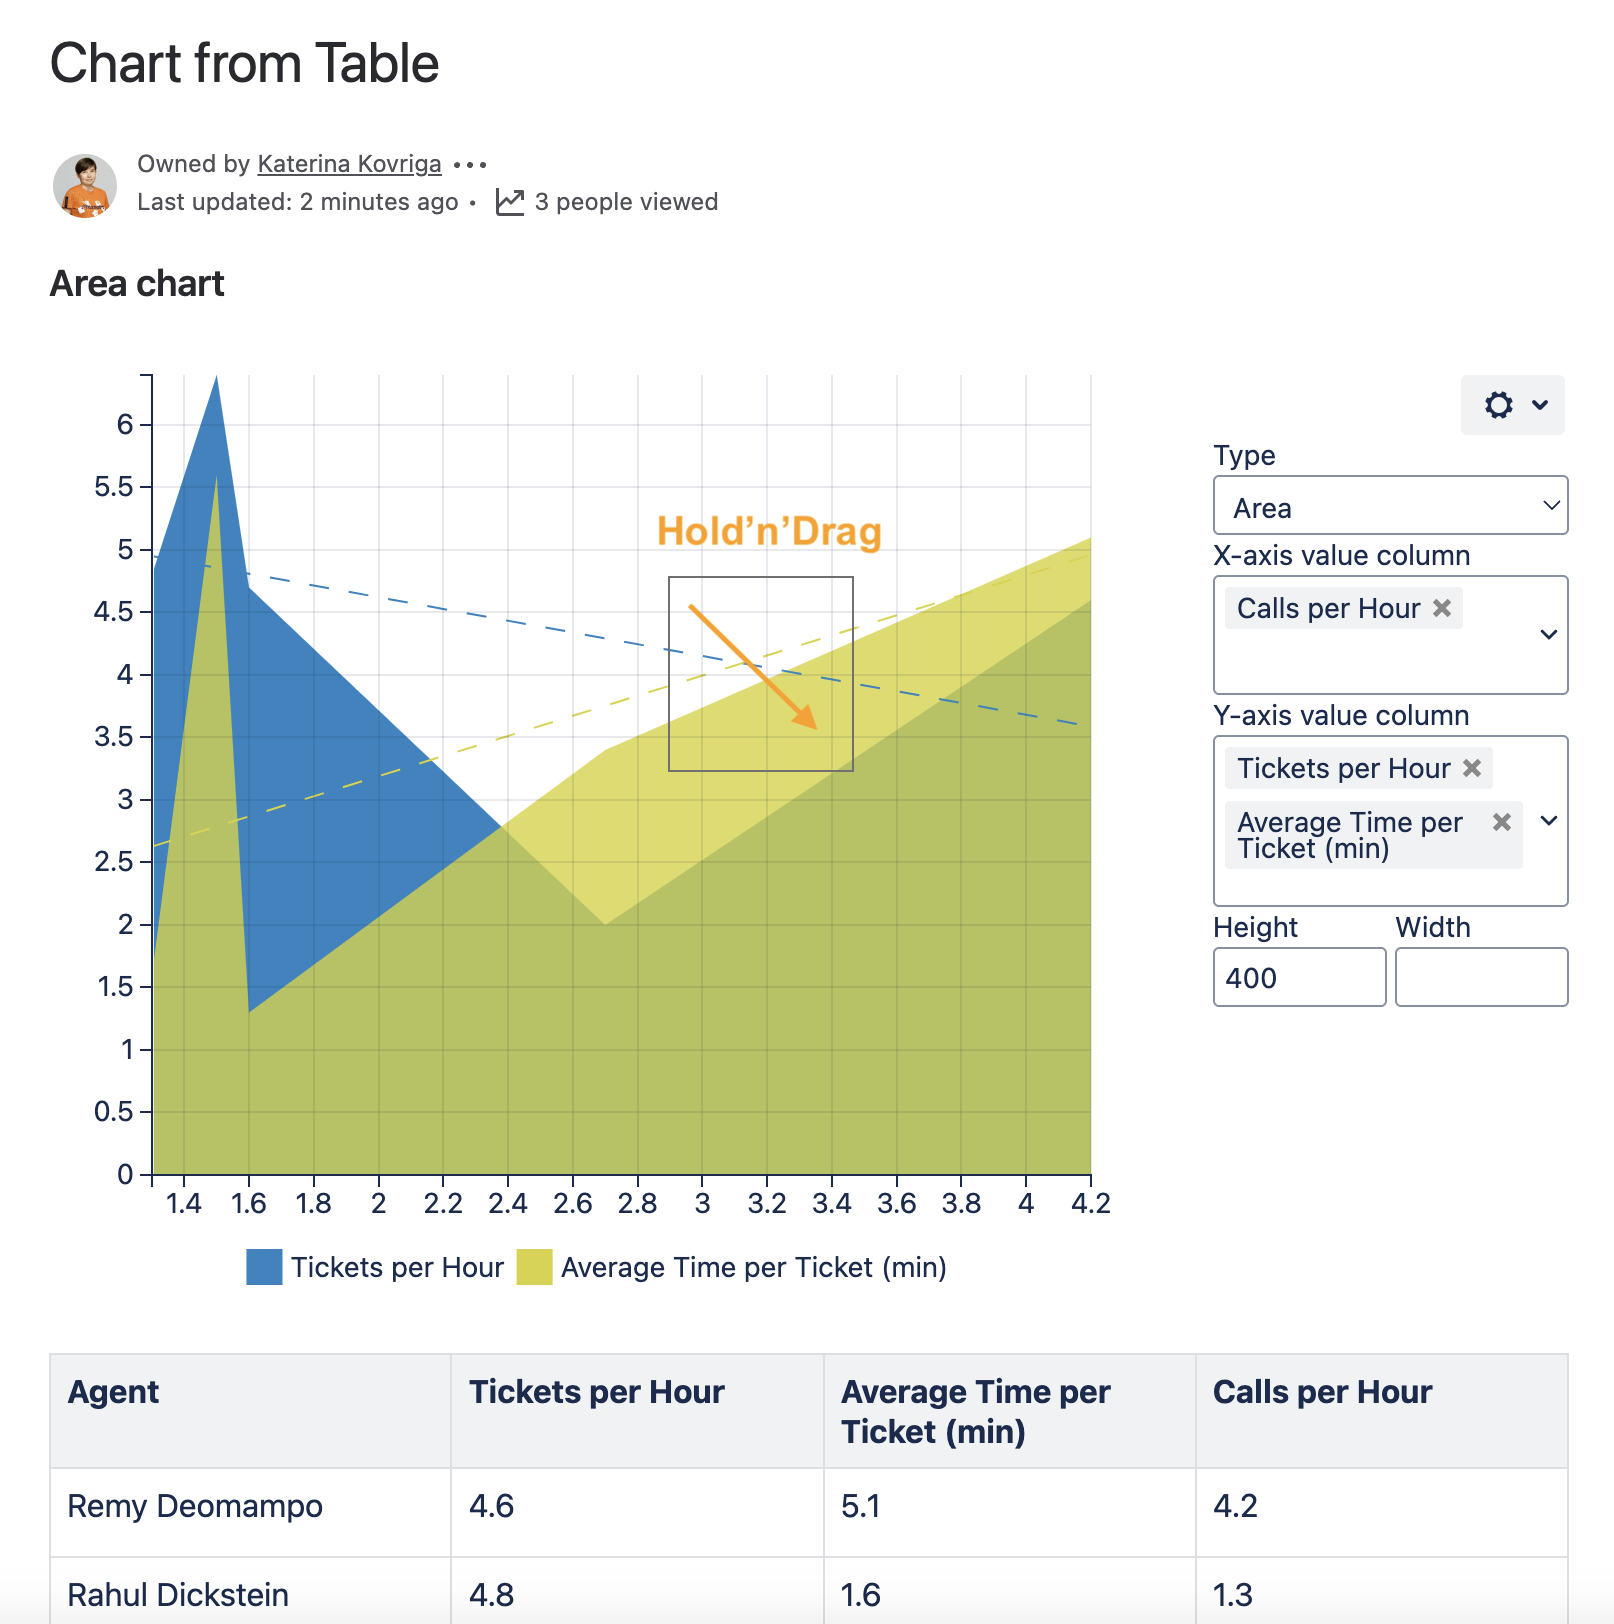
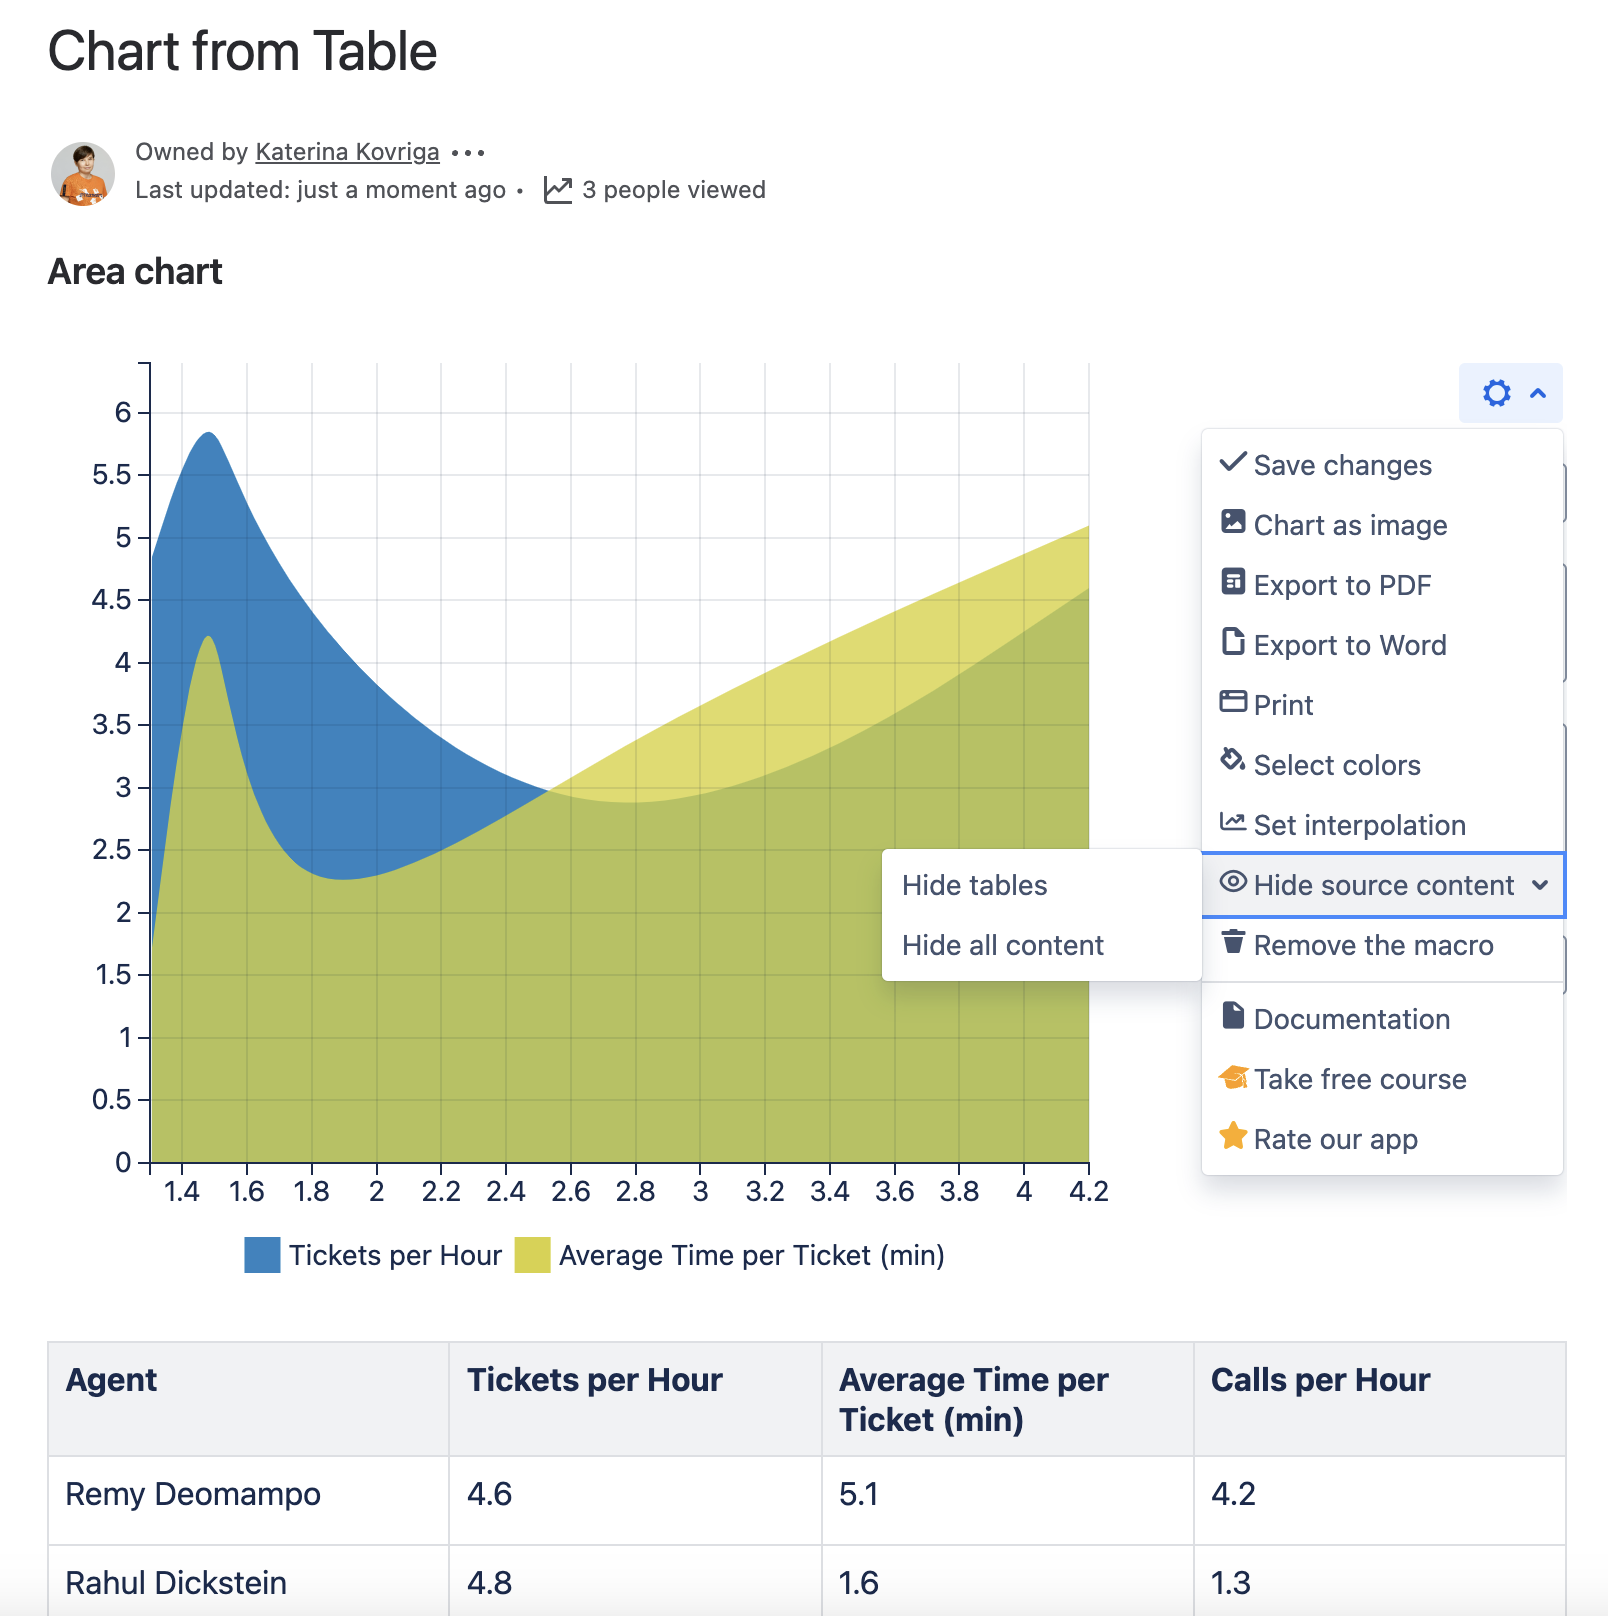
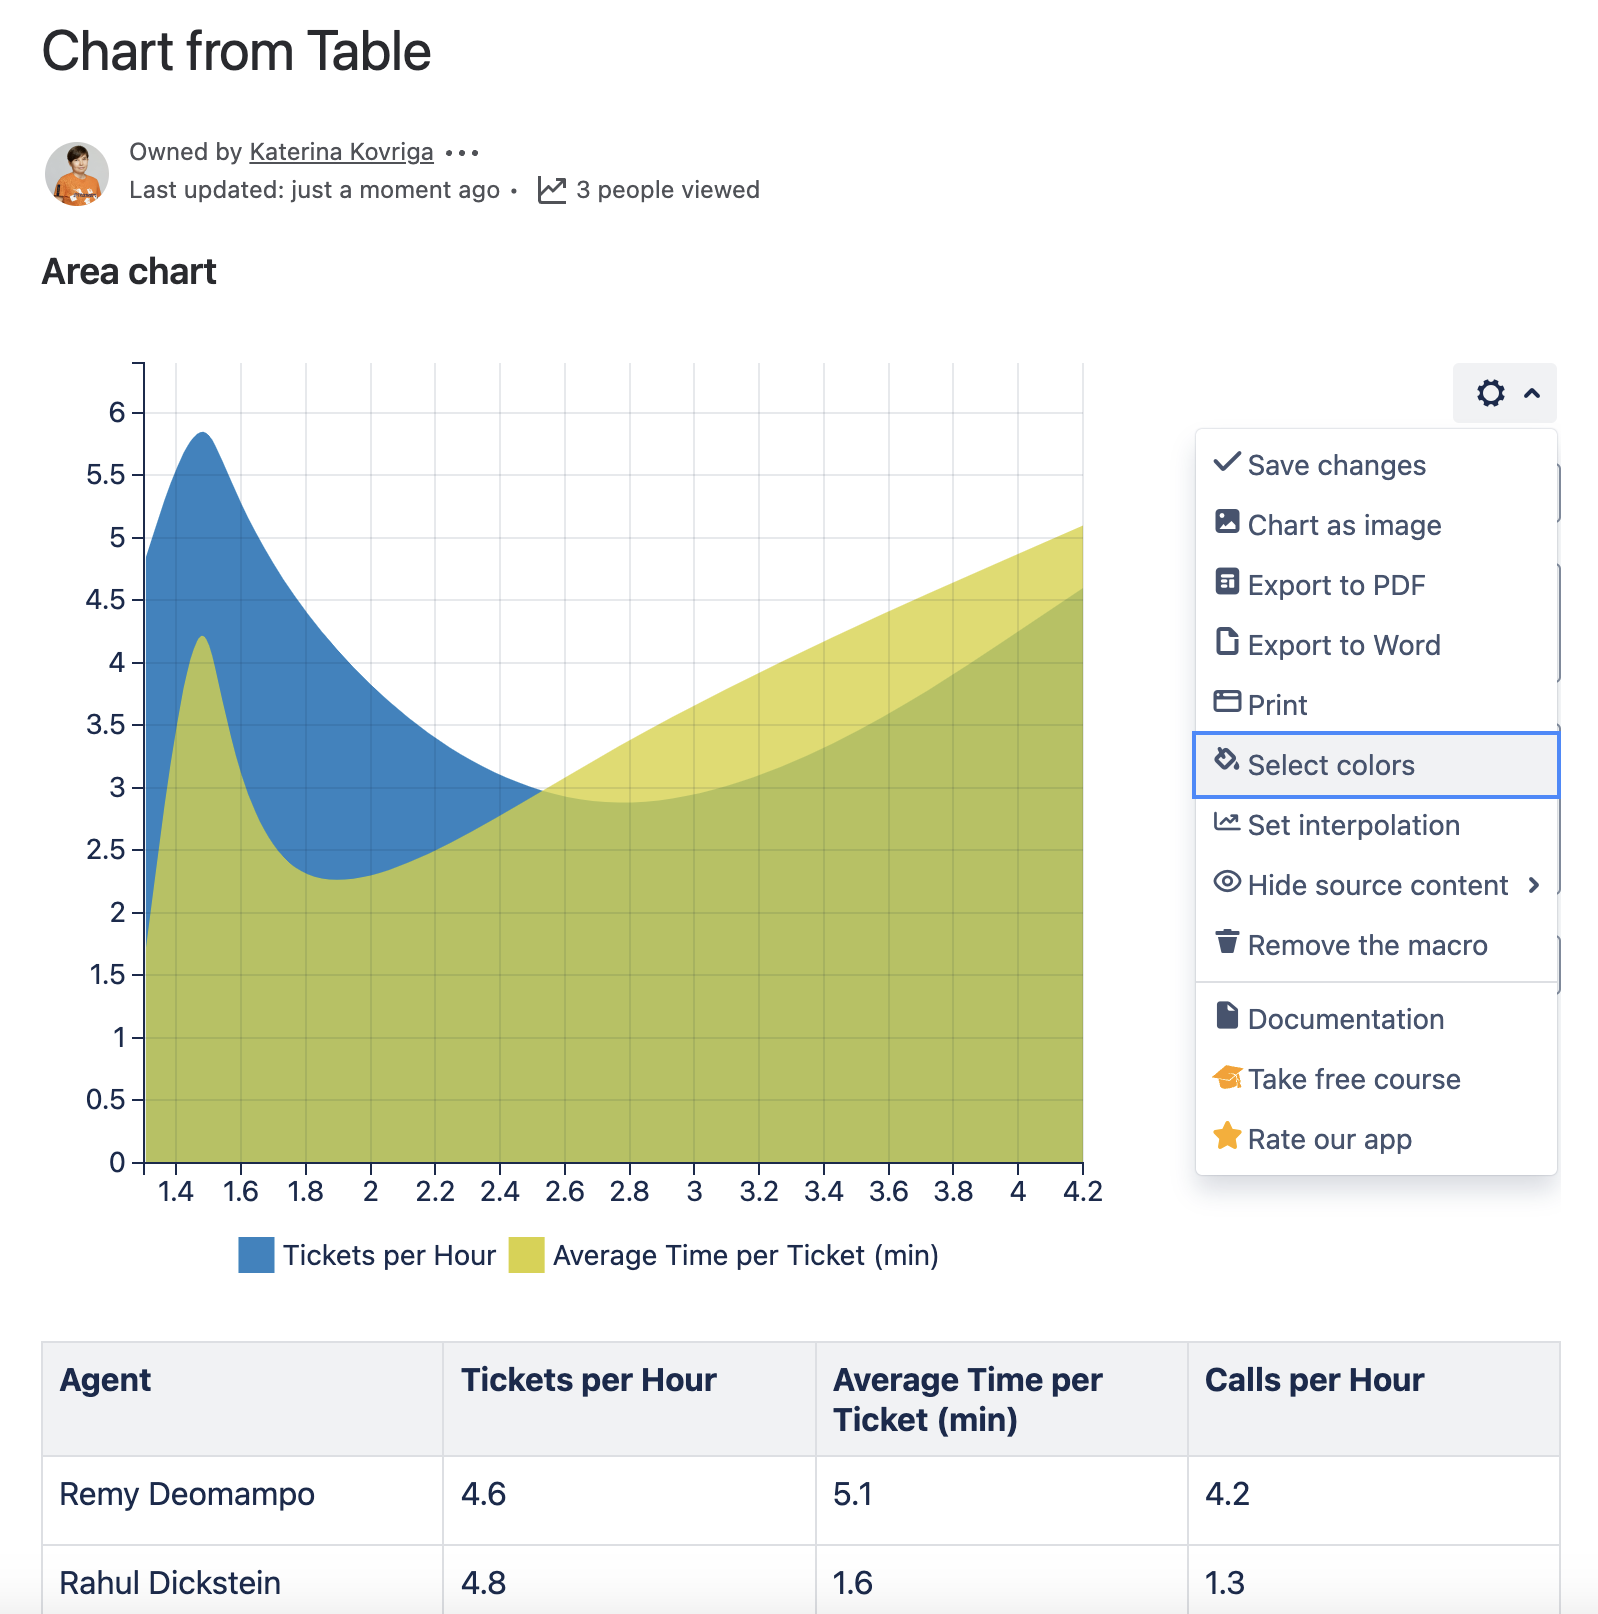
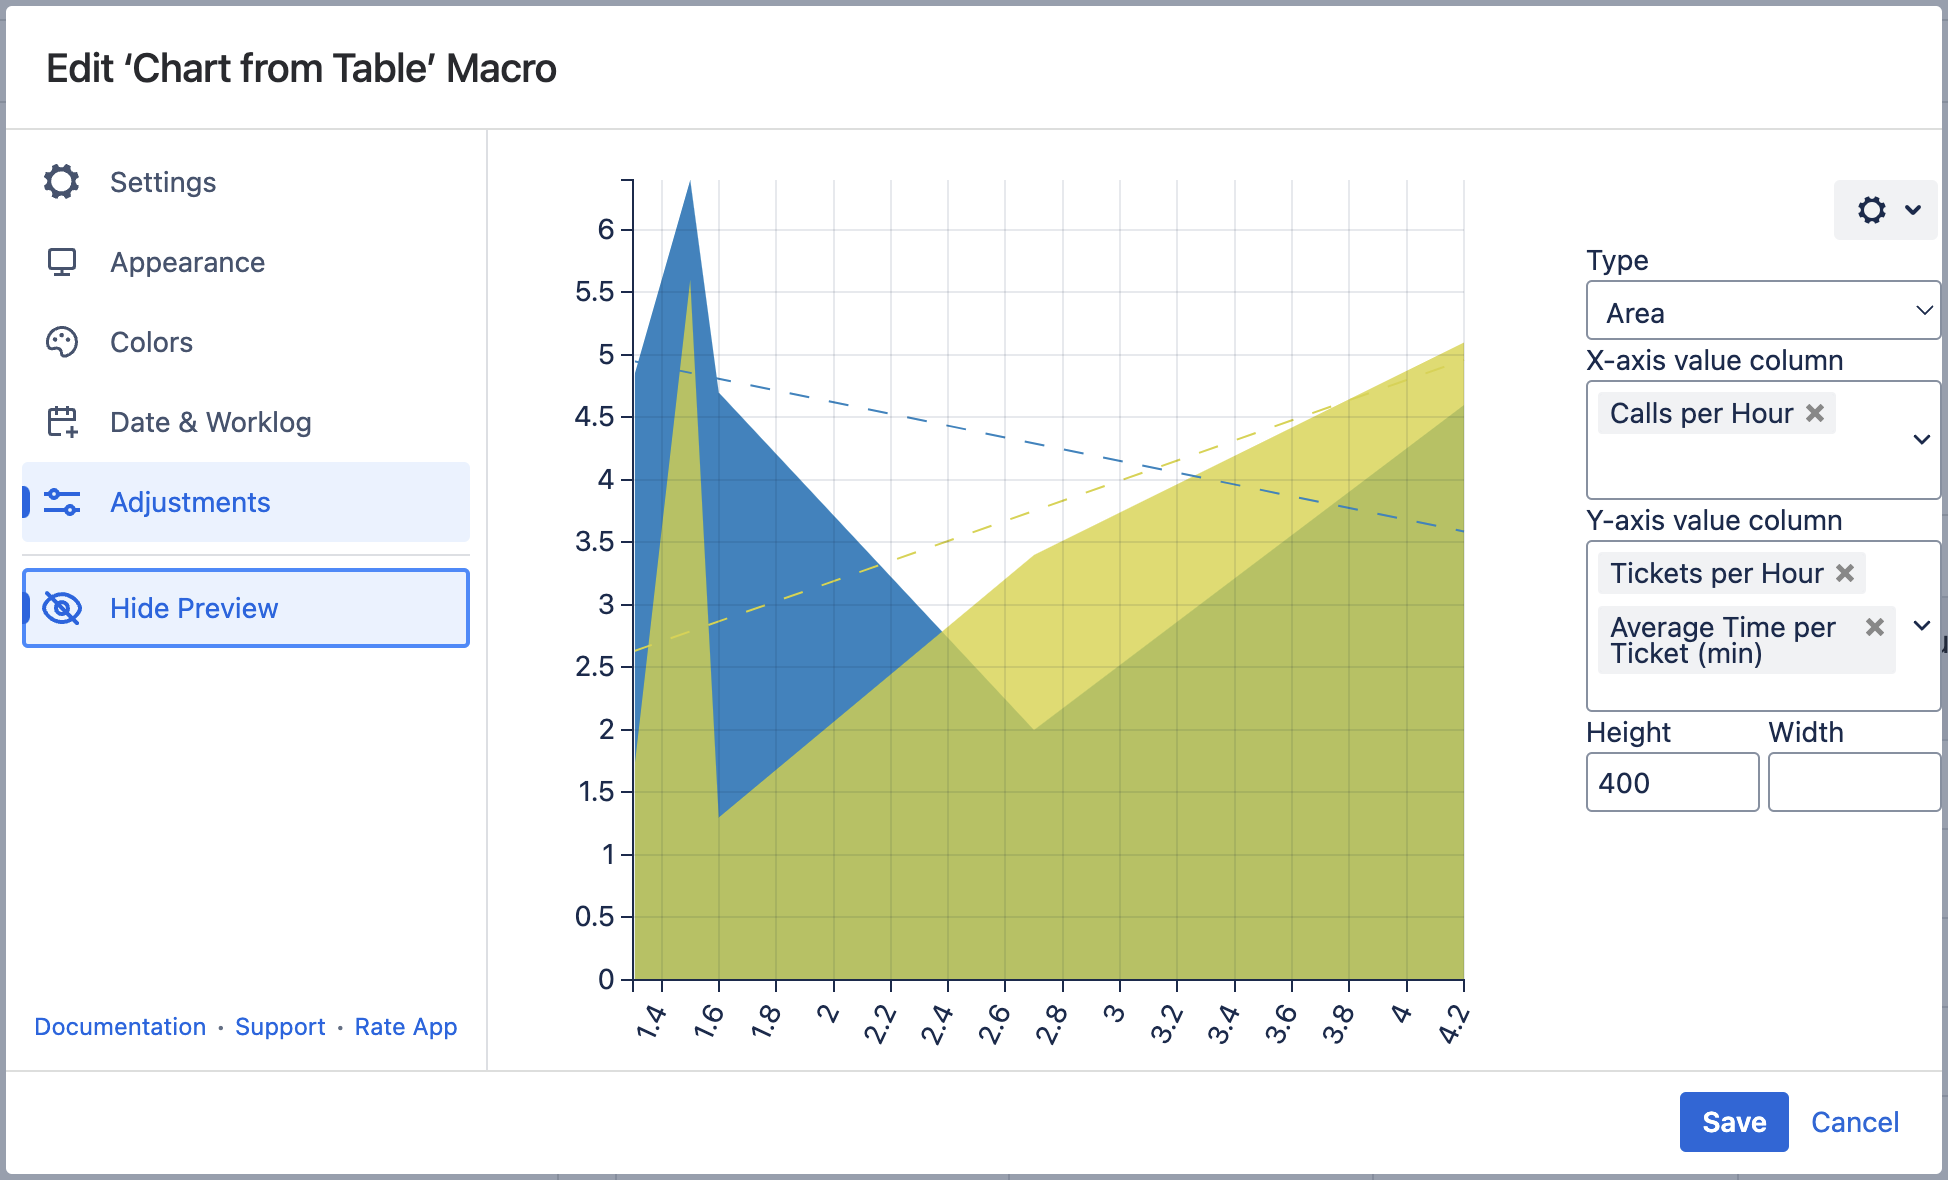
Rendered Chart
Parameters in Macro Browser
| Type | Line / Area / Stacked area |
|---|---|
| X-axis value column | Tickets per Hour |
| Y-axis value column | Calls per Hour |
Data Table in Macro Placeholder
| Agent | Tickets per Hour | Average Time per Ticket (min) | Calls per Hour |
|---|---|---|---|
| Remy Deomampo | 4.6 | 5.1 | 4.2 |
| Rahul Dickstein | 4.8 | 1.6 | 1.3 |
| Radu Donahue | 6.4 | 5.6 | 1.5 |
| Preston Doorey | 4.7 | 1.3 | 1.6 |
| Phill Doyle | 2.0 | 3.4 | 2.7 |
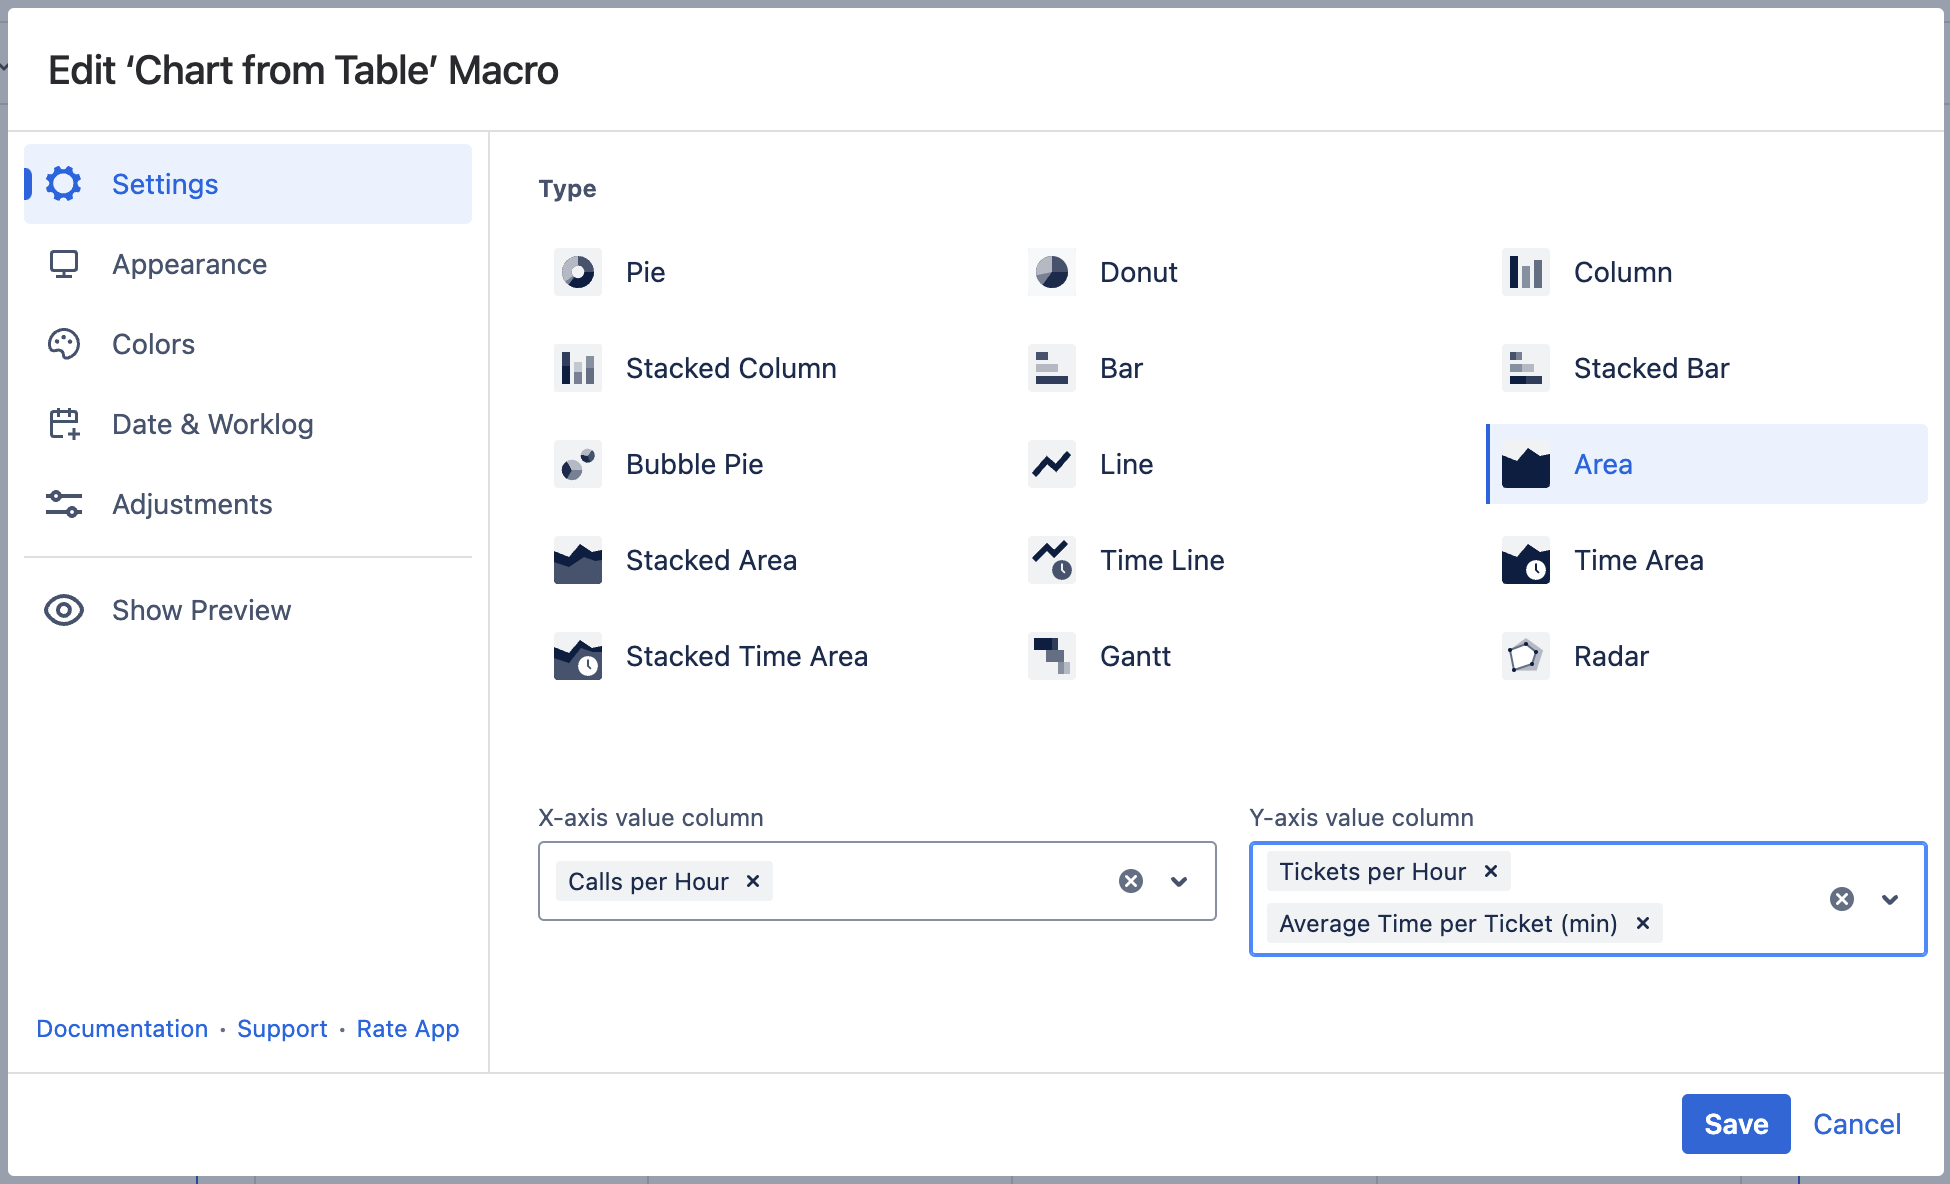
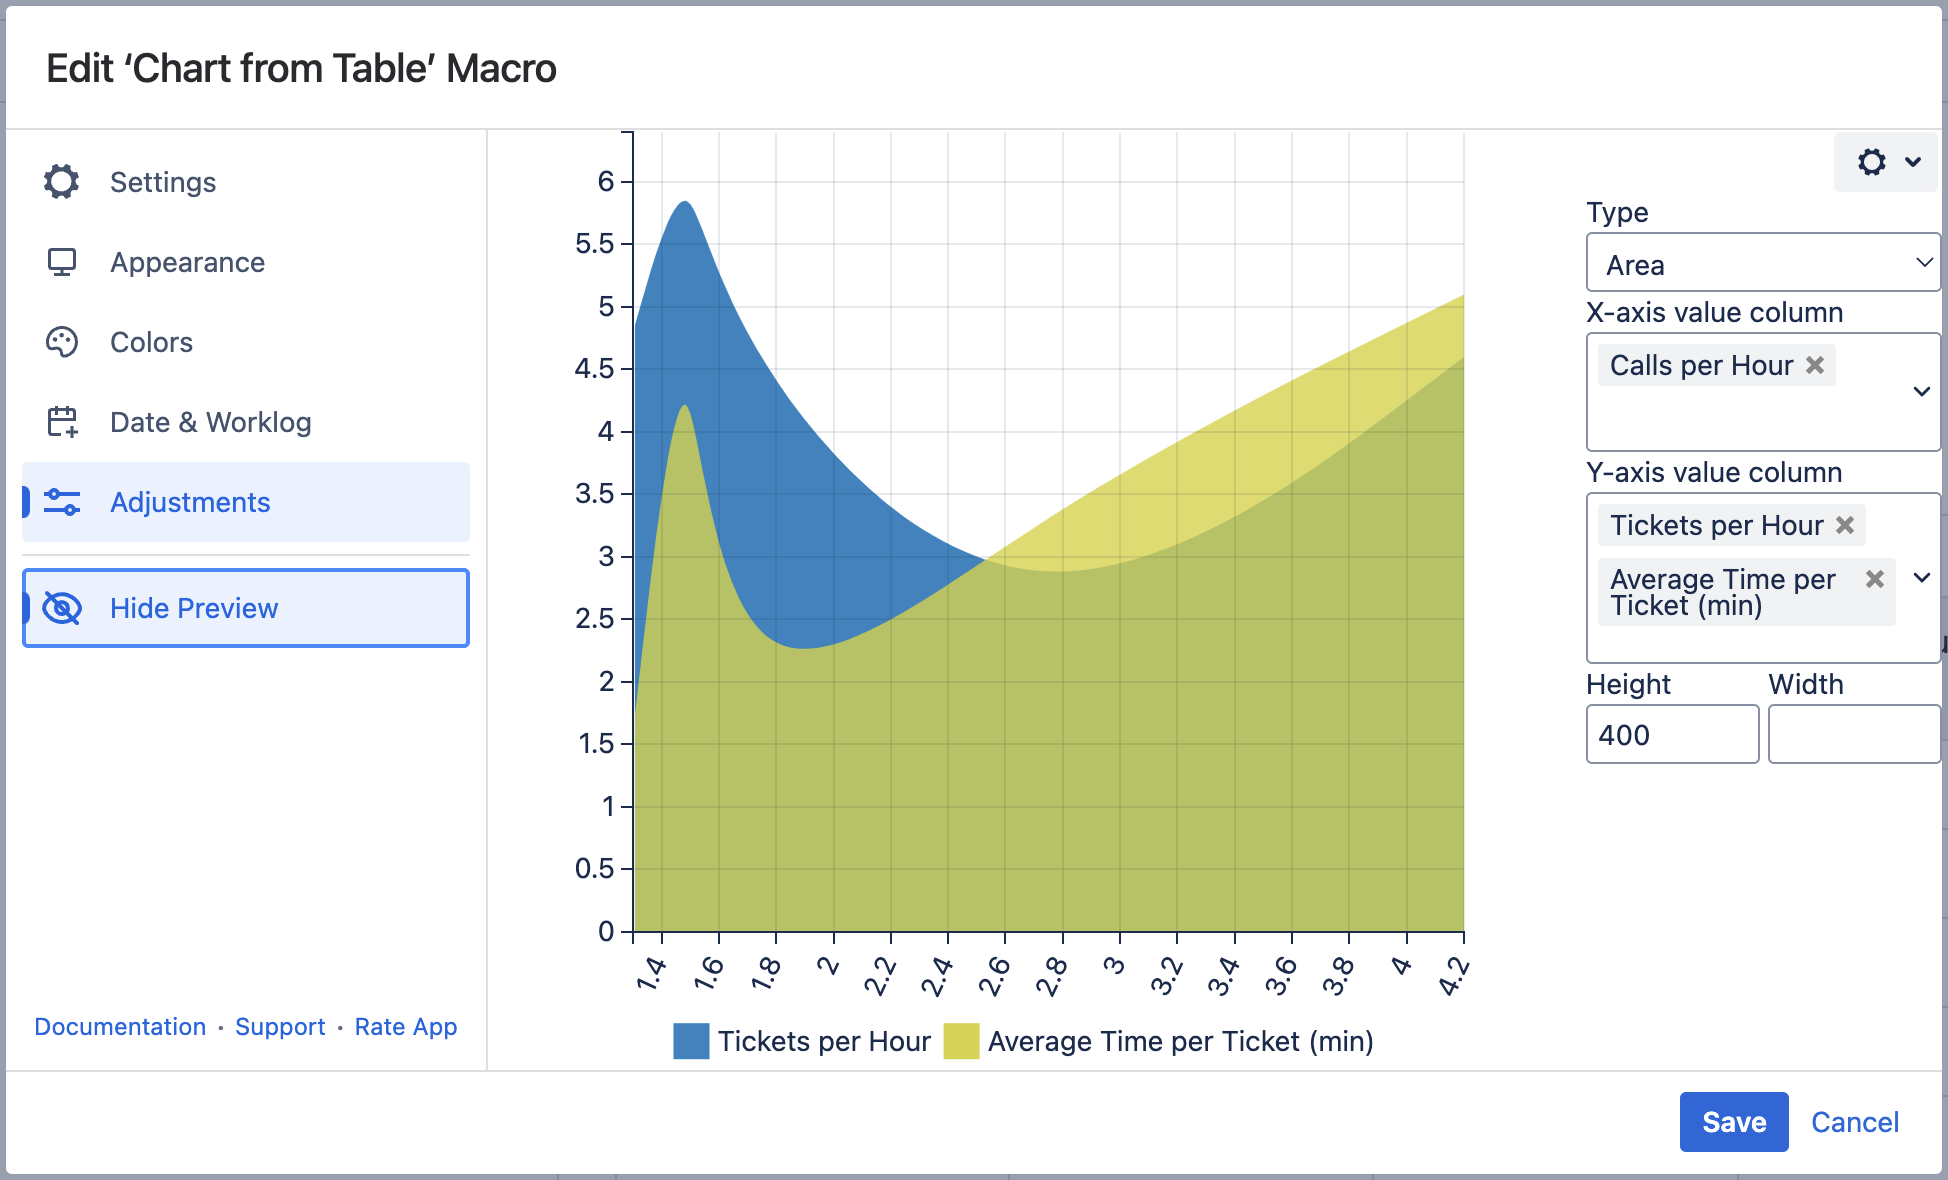
Settings Tab
Select the chart type
To select the chart type in the page view mode:
- Insert the Chart from Table macro.
- Hover over the chart controls on the right of the table.
- Locate the Type option and select the chart type. The chart will be automatically regenerated.
- To save the modifications in the macro body, click the cogwheel icon and select Save changes.
To select the chart type in the macro browser:
- Switch the page to the edit mode.
- Insert the Chart from Table macro and paste the table within the macro body.
- Select the macro and click Edit.
- Locate the Type option in the Settings tab and select the chart type.
- Save the macro and the page.
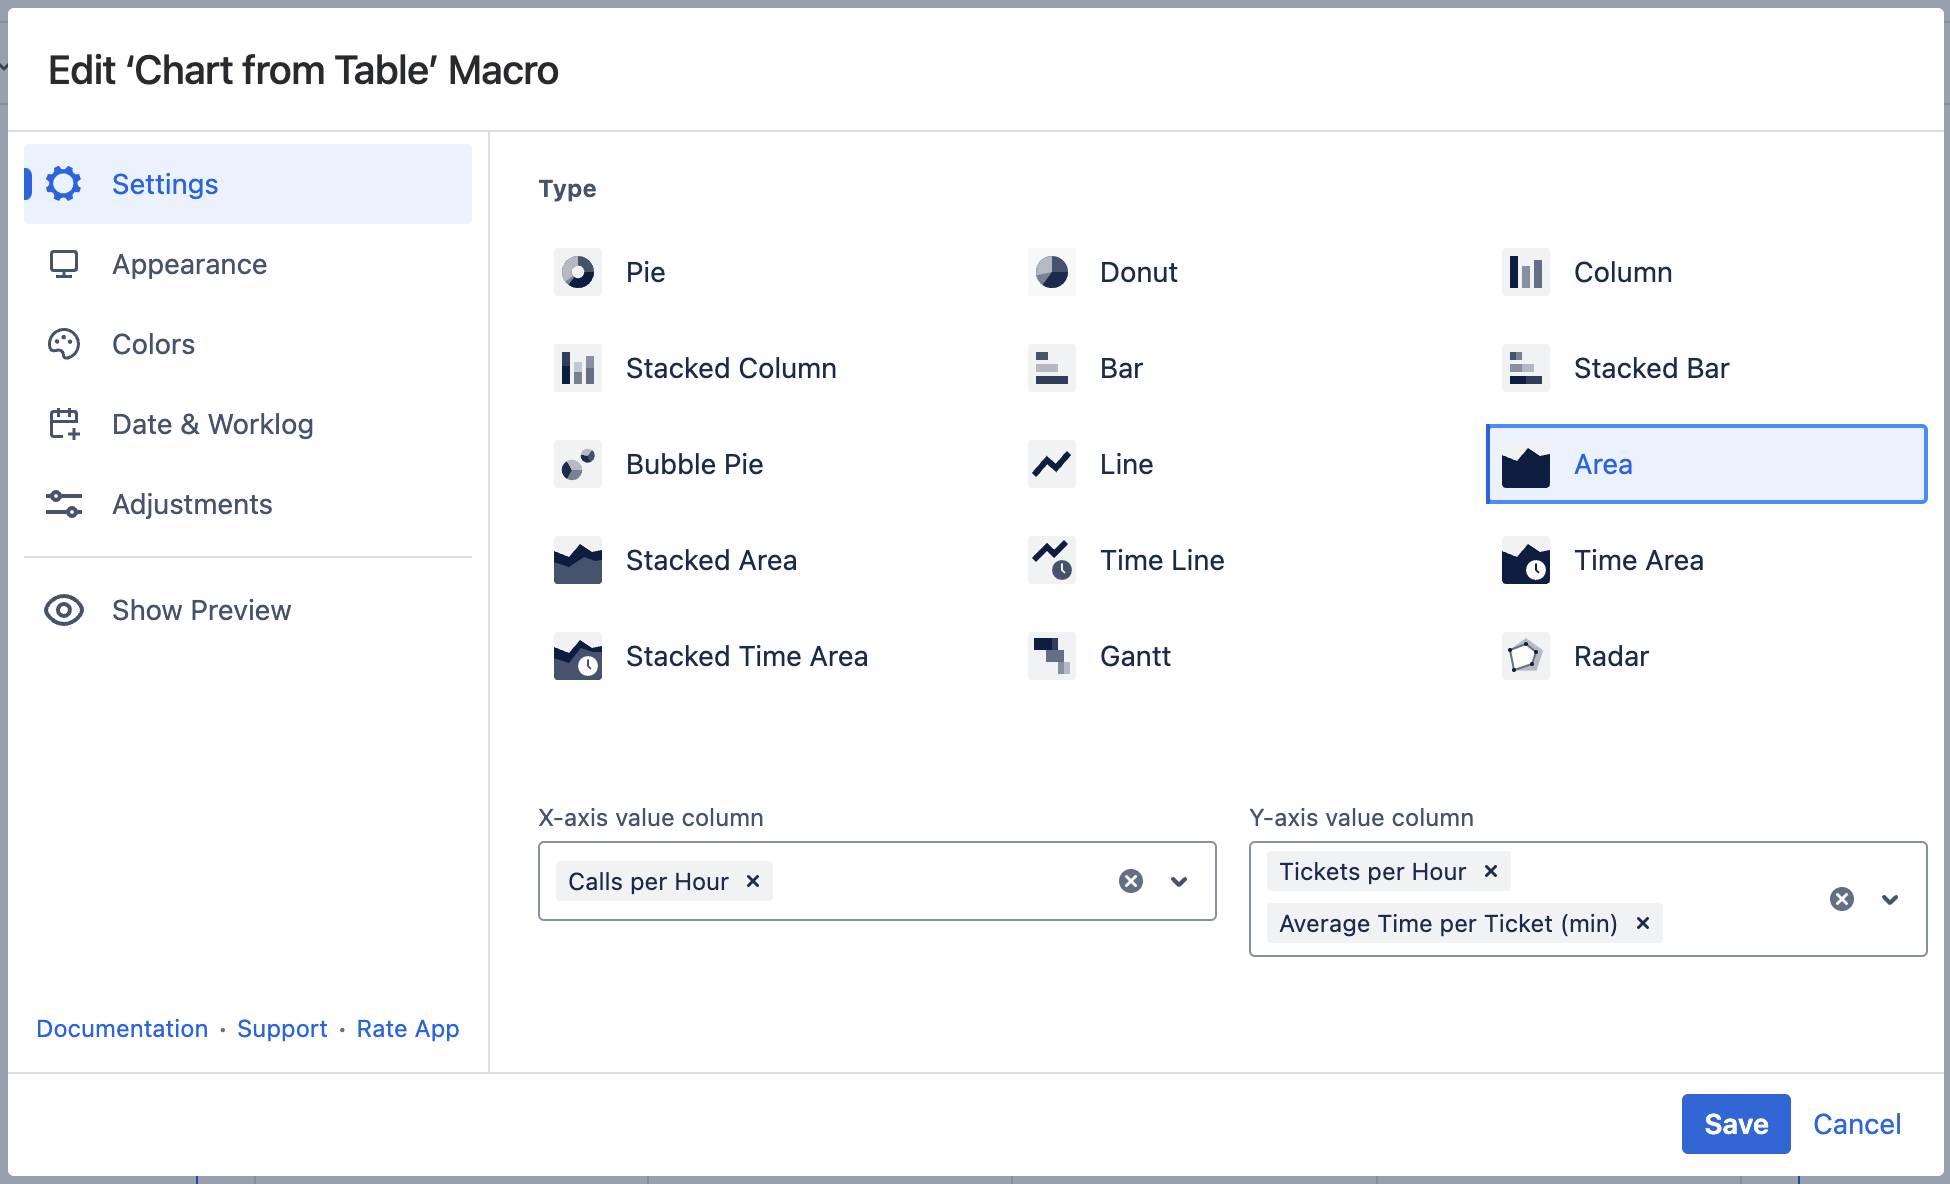
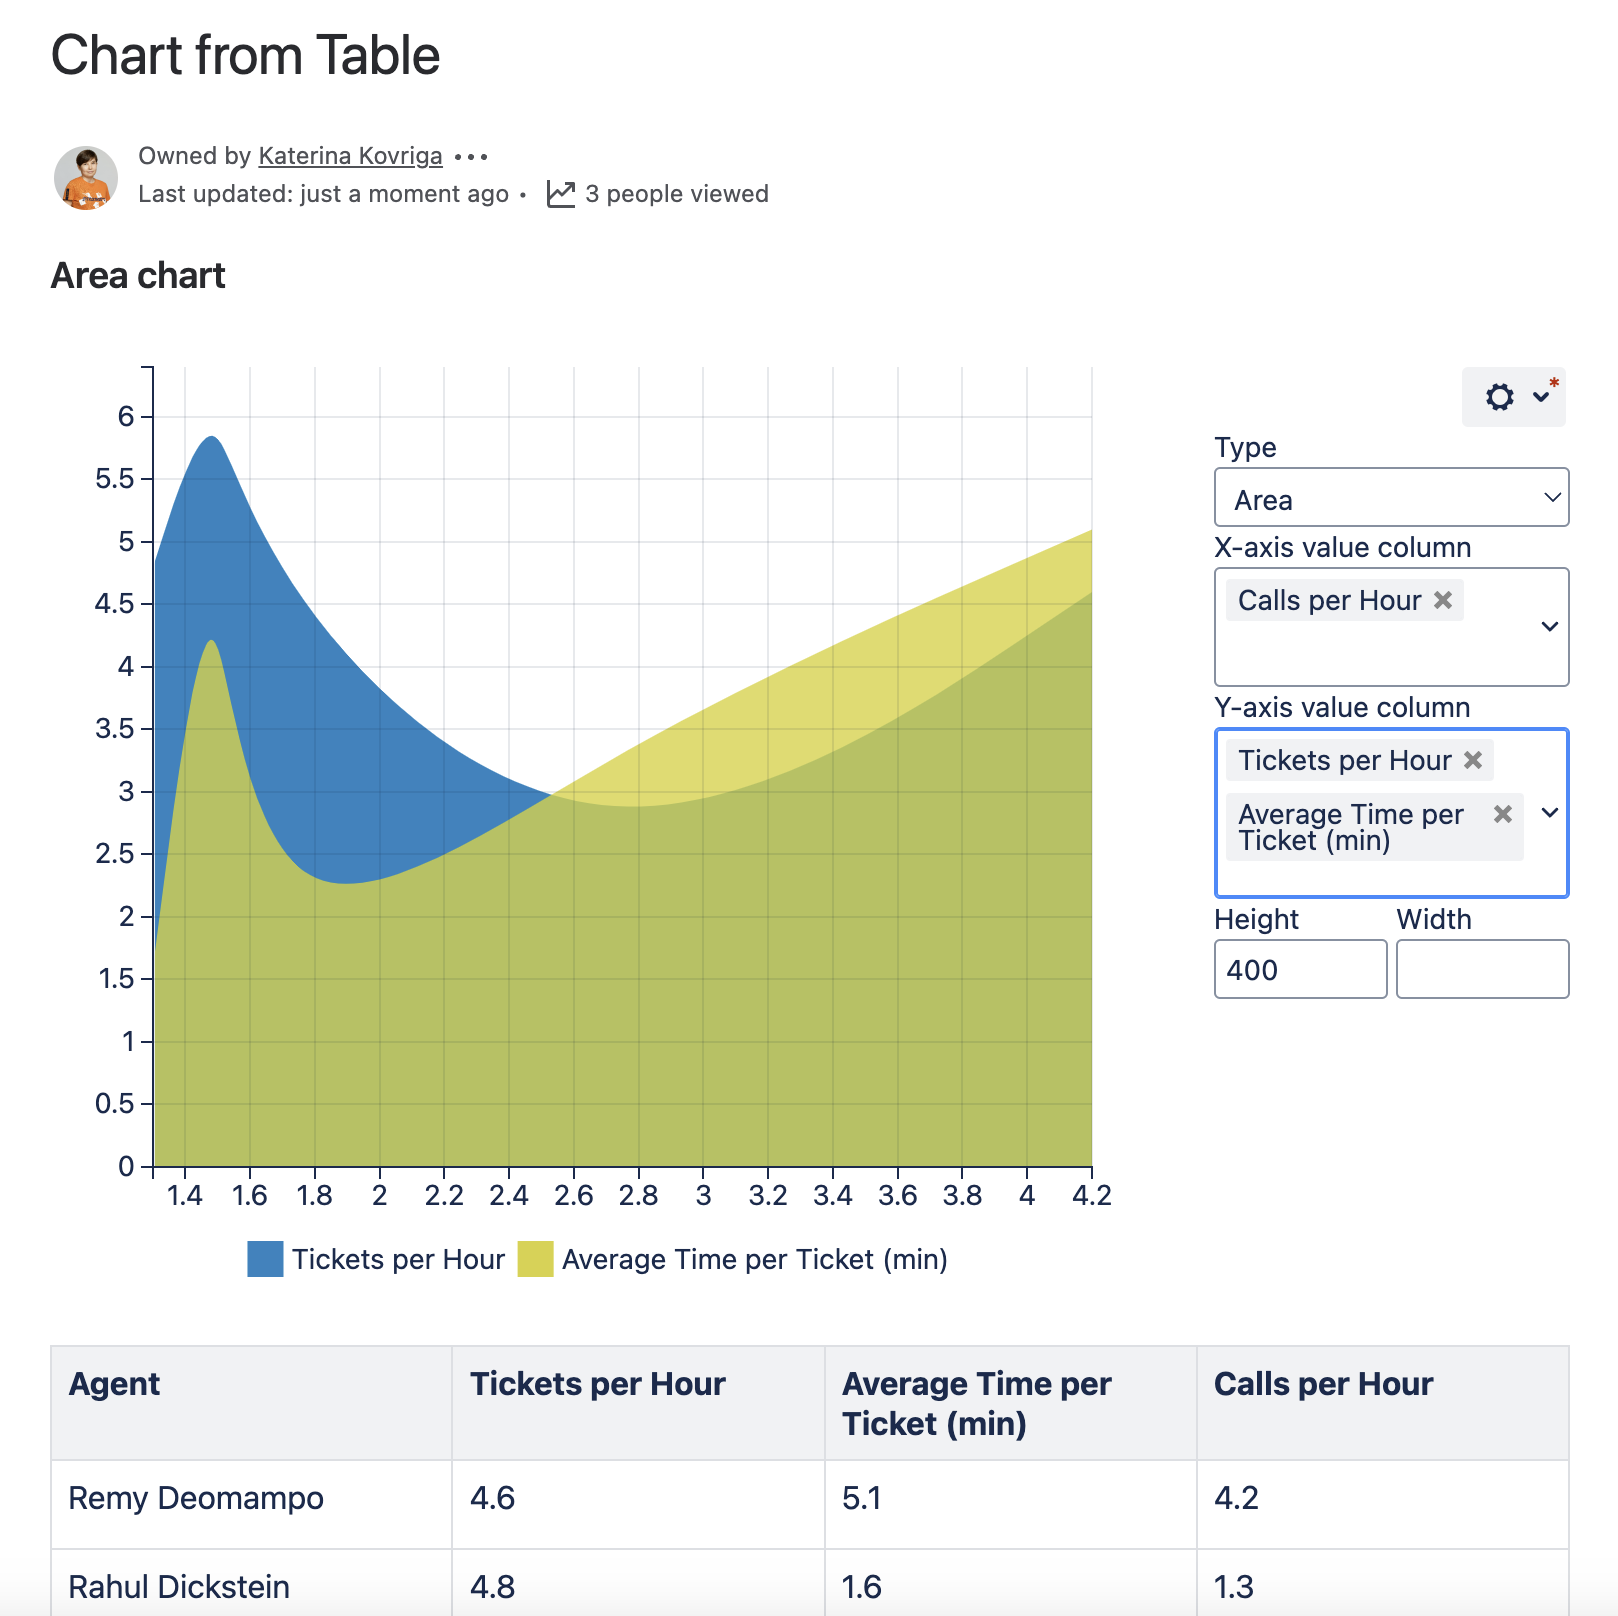
Select data series
X-axis value column - the column containing numerical values for chart generation (horizontal axis).
Y-axis value column - the column or columns containing numerical values for chart generation (vertical axis).
To select data series in the page view mode:
- Insert the Chart from Table macro.
- Hover over the chart controls on the right of the table.
- Locate the X-axis value column and Y-axis value column options and select the table columns containing data for chart generation. The chart will be automatically regenerated.
- To save the modifications in the macro body, click the cogwheel icon and select Save changes.
To select data series in the macro browser:
- Switch the page to the edit mode.
- Insert the Chart from Table macro and paste the table within the macro body.
- Select the macro and click Edit.
- Locate the X-axis value column and Y-axis value column options in the Settings tab and select the table columns containing data for chart generation.
- Save the macro and the page.
Adjustments Tab
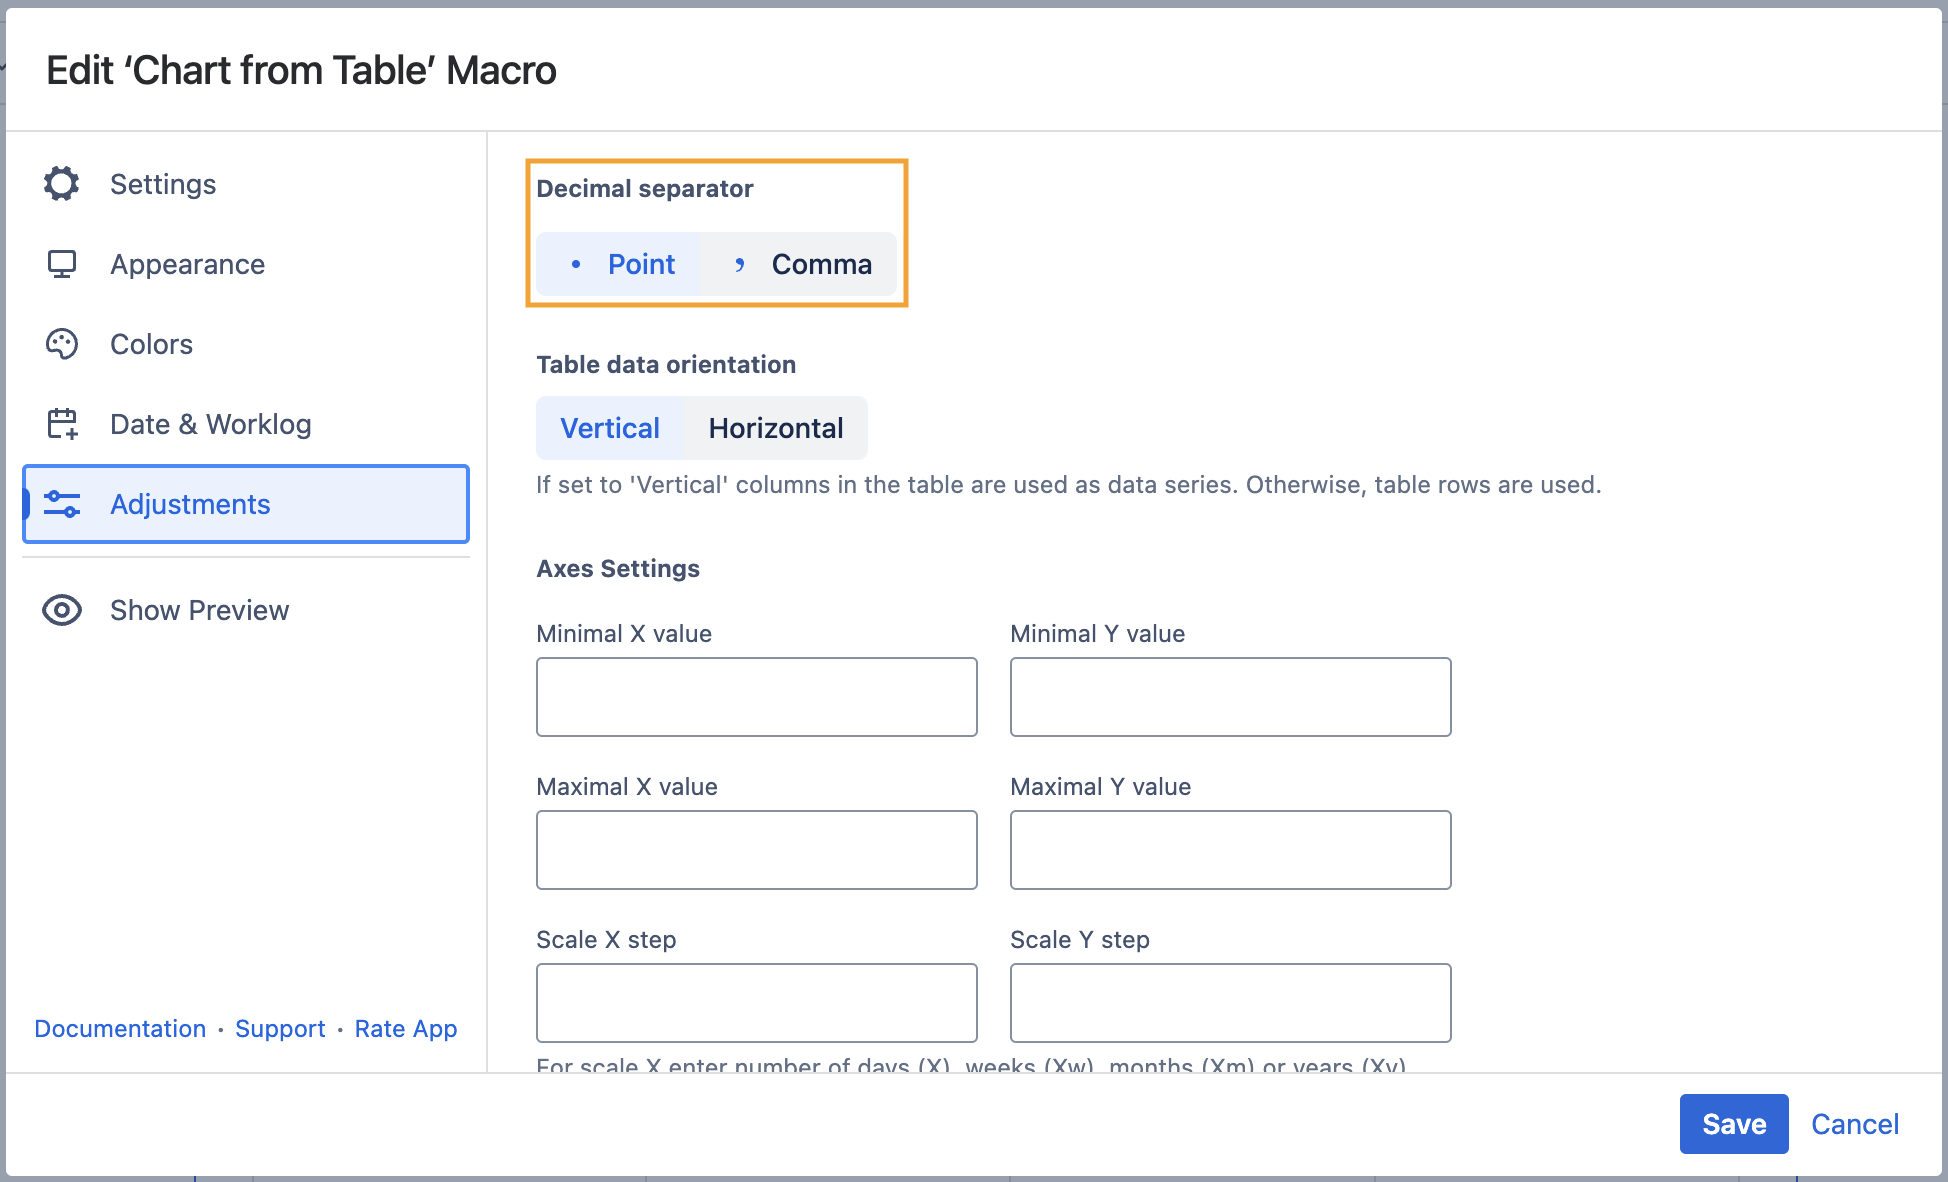
Set the decimal separator
- Switch the page to the edit mode.
- Select the macro and click Edit.
- Switch to the Adjustments tab.
- Locate the Decimal separator option.
- Specify the correct decimal separator for numeric values in the source table (point or comma).
- Save the macro and the page.
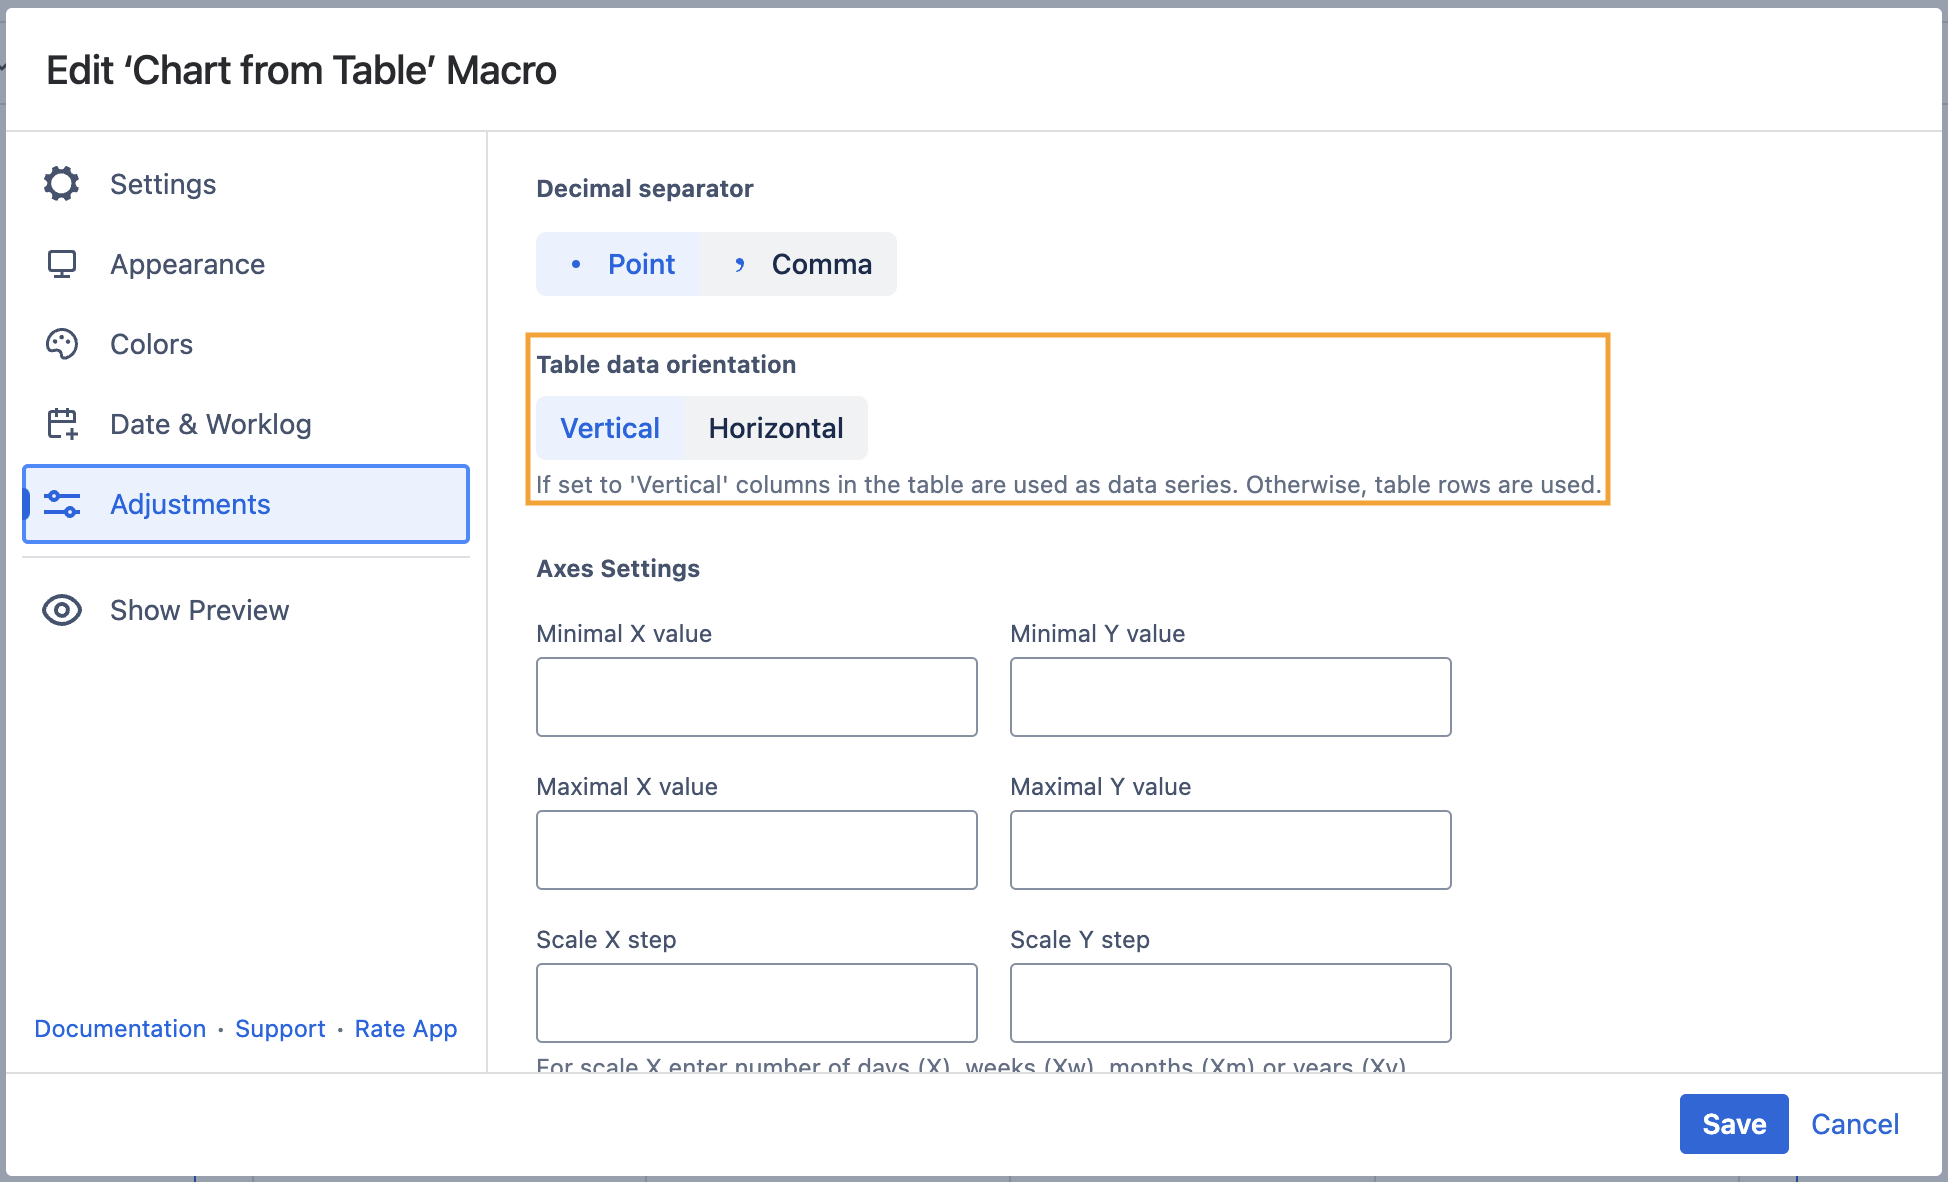
Set the table data orientation
- Switch the page to the edit mode.
- Select the macro and click Edit.
- Switch to the Adjustments tab.
- Locate the Table data orientation option.
- Select the Vertical or Horizontal option.
- Save the macro and the page.
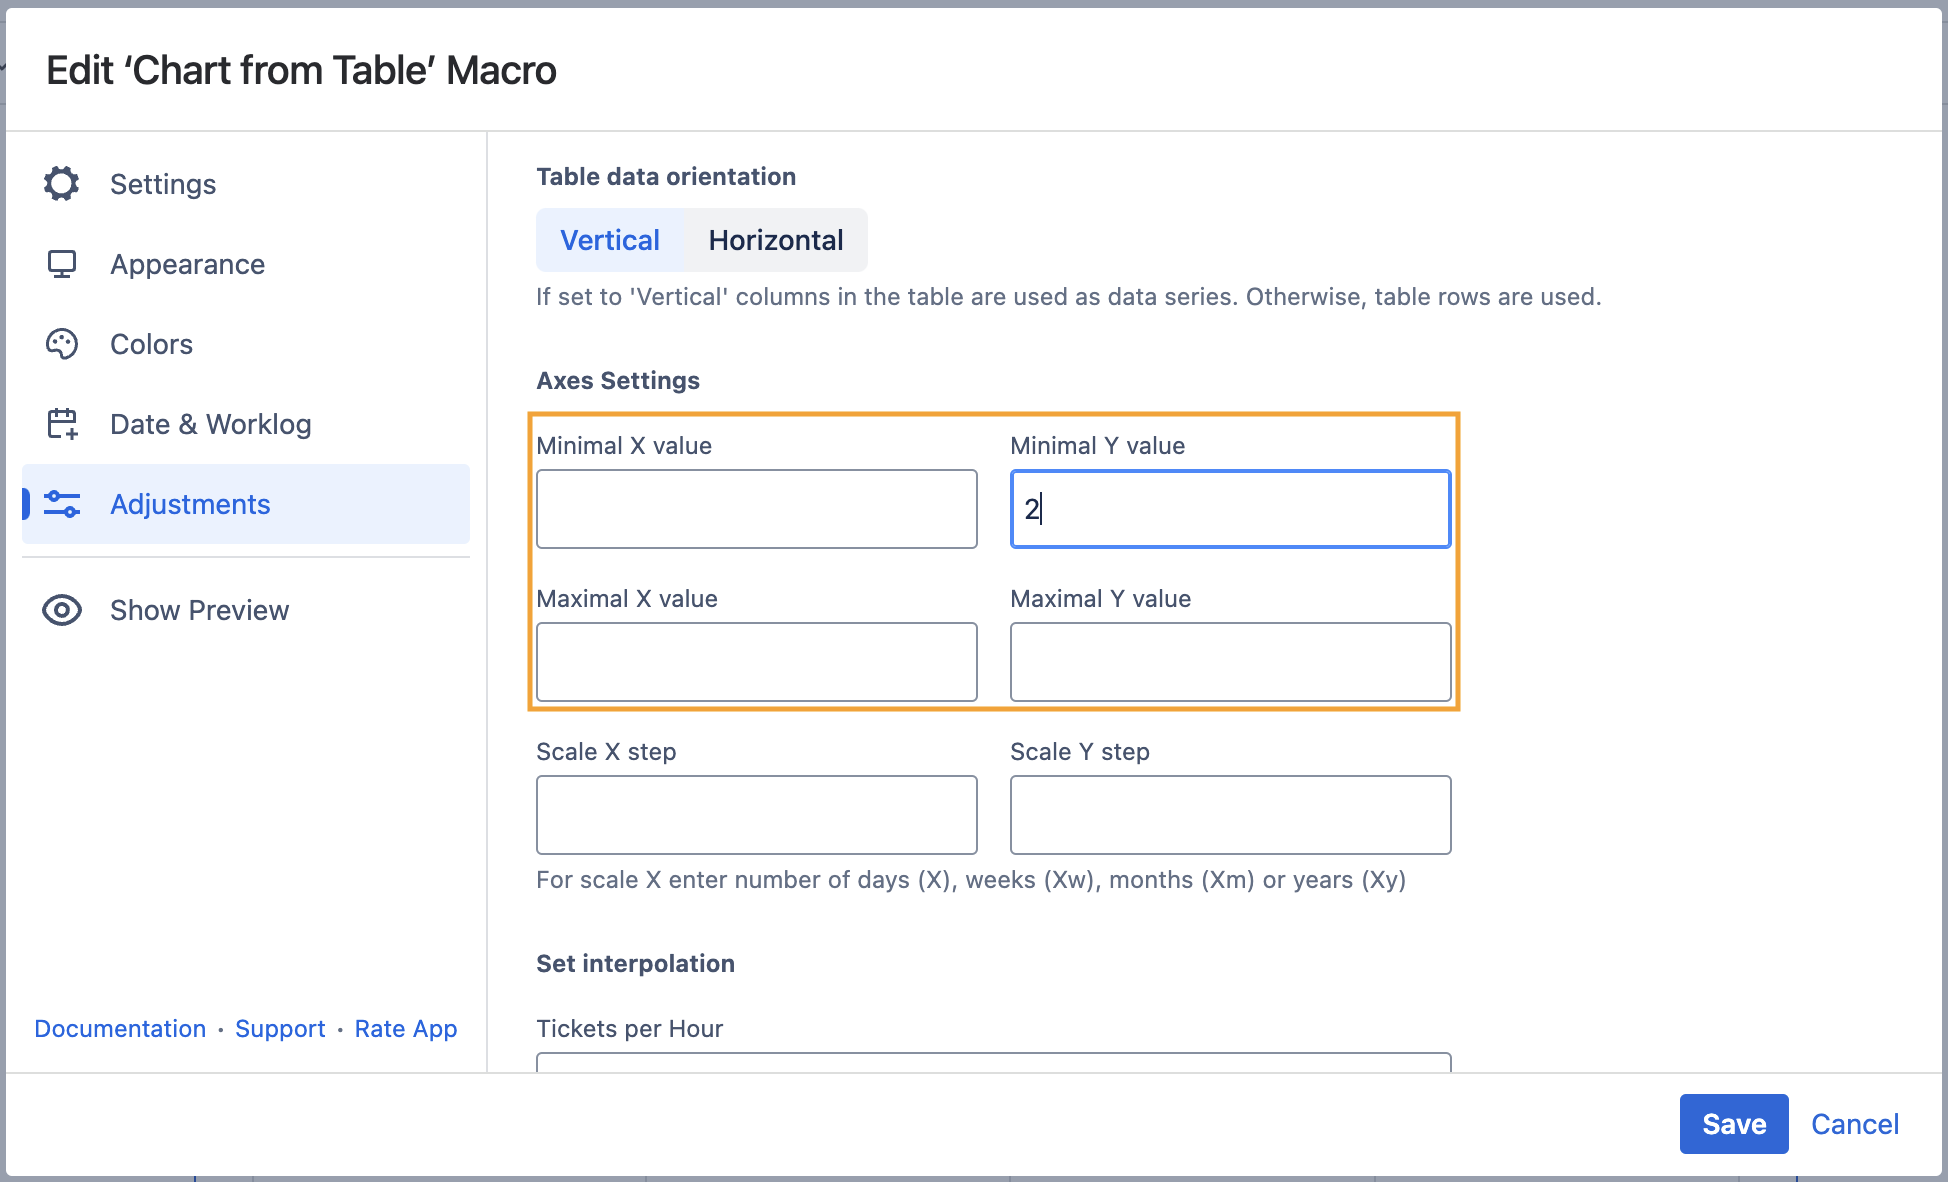
Set the minimal and maximal values
Minimal X (Y) value - the minimal value for X (Y) axis for showing only data values greater than the specified minimal value.
Maximal X (Y) value - the maximal value for X (Y) axis for showing only data values not greater than the specified maximal value.
- Switch the page to the edit mode.
- Select the macro and click Edit.
- Switch to the Adjustments tab.
- Locate the Minimal X (Y) and Maximal X (Y) value options and set the minimal and maximal values.
- Save the macro and the page.
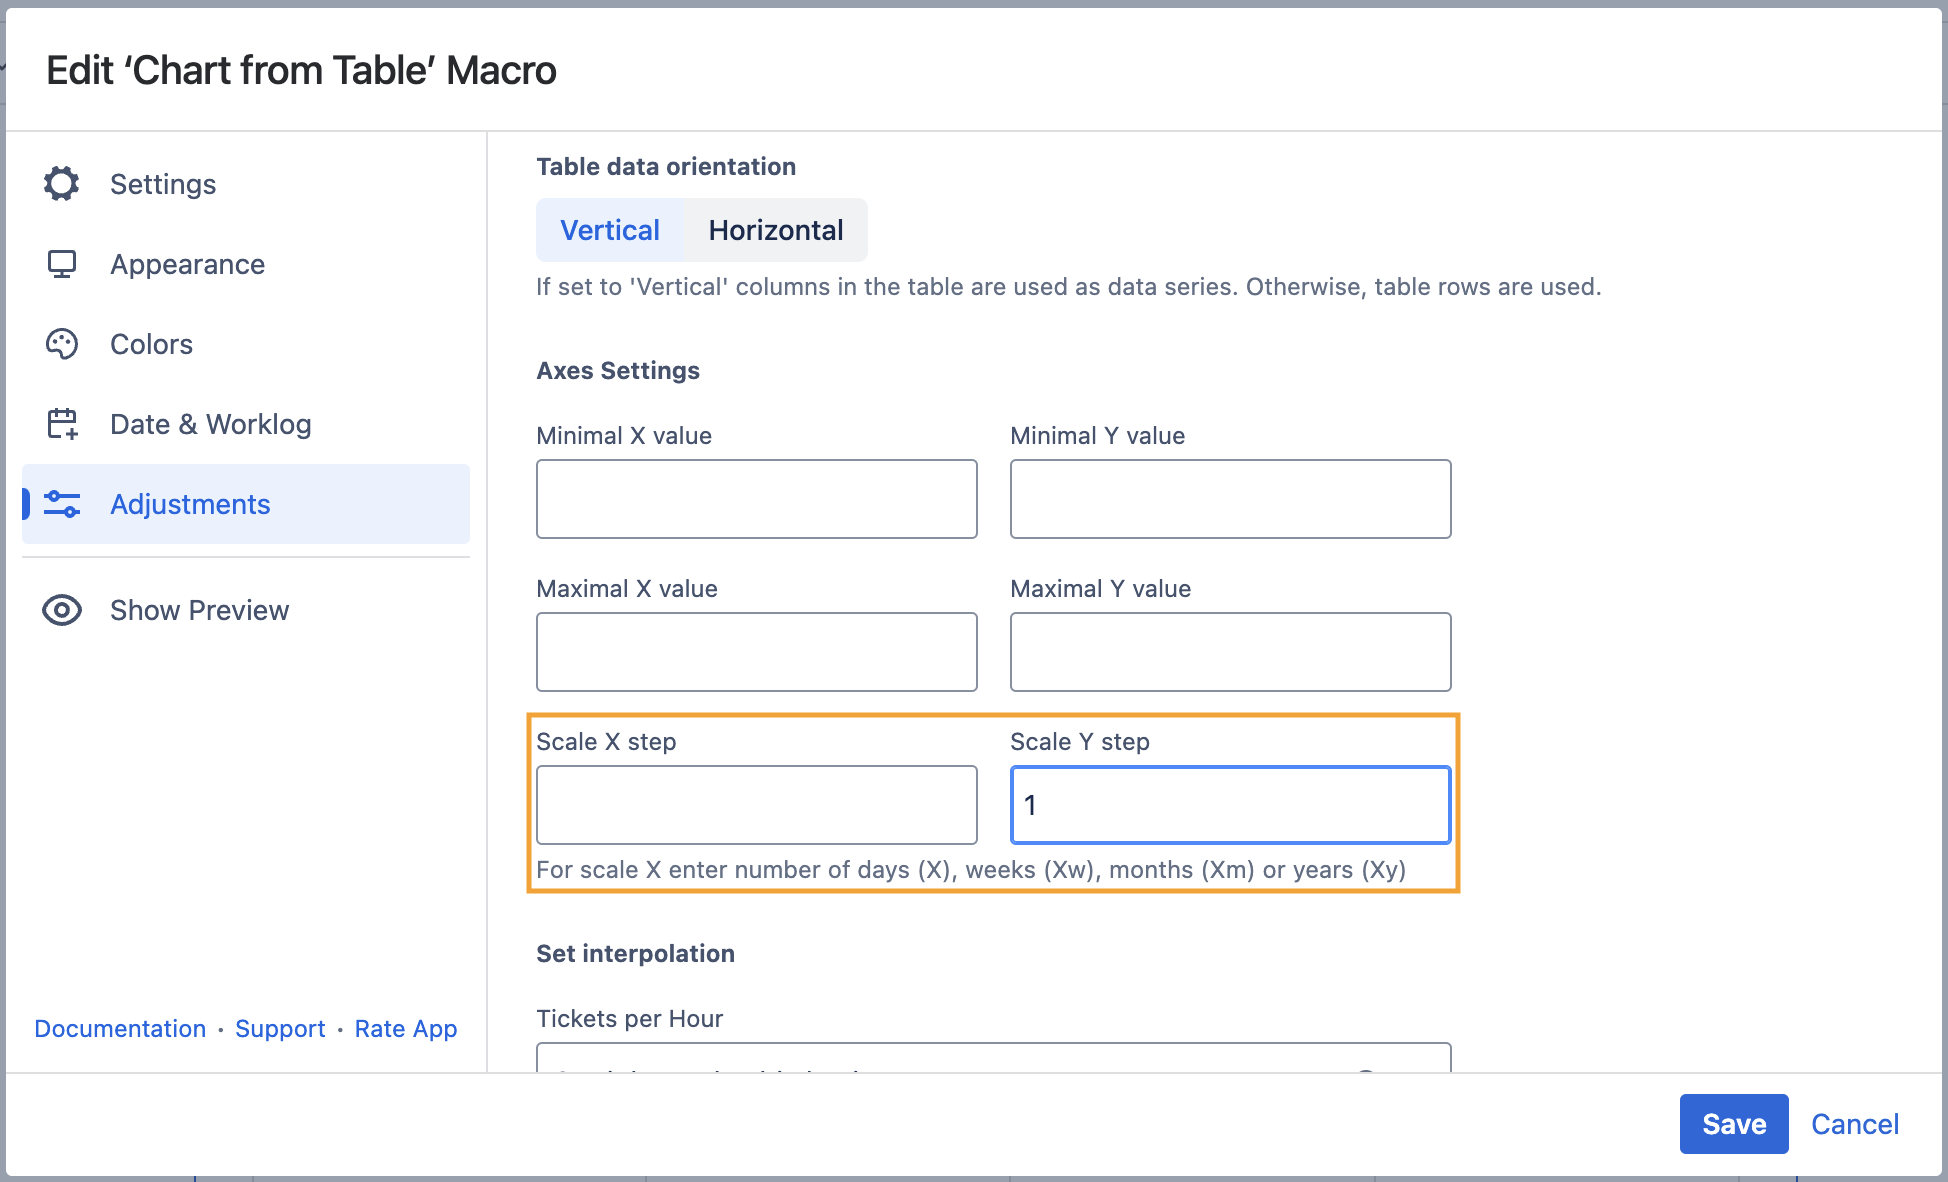
Set the scale step
Scale X (Y) Step - the required scale step of Y axis for showing the chart.
- Switch the page to the edit mode.
- Select the macro and click Edit.
- Switch to the Adjustments tab.
- Locate the Scale X (Y) Step options and set the scale step.
- Save the macro and the page.
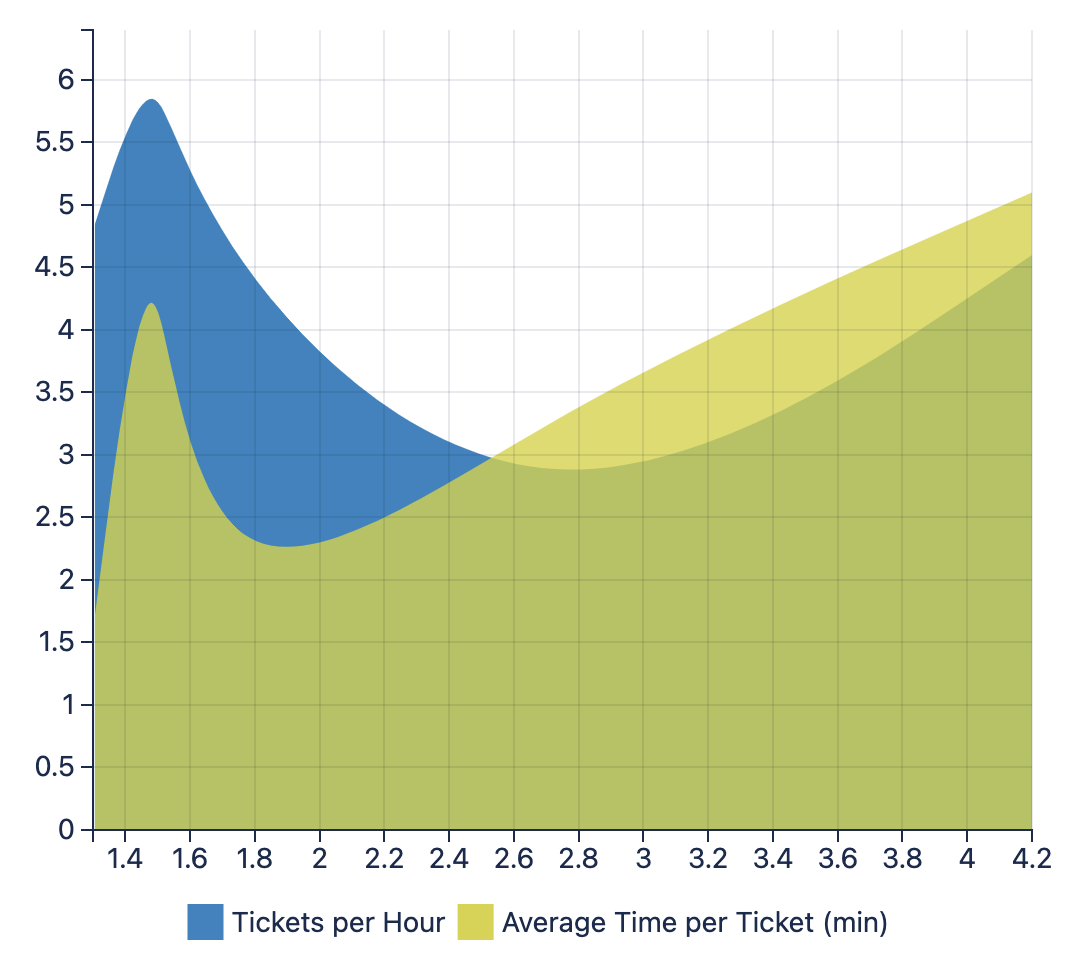
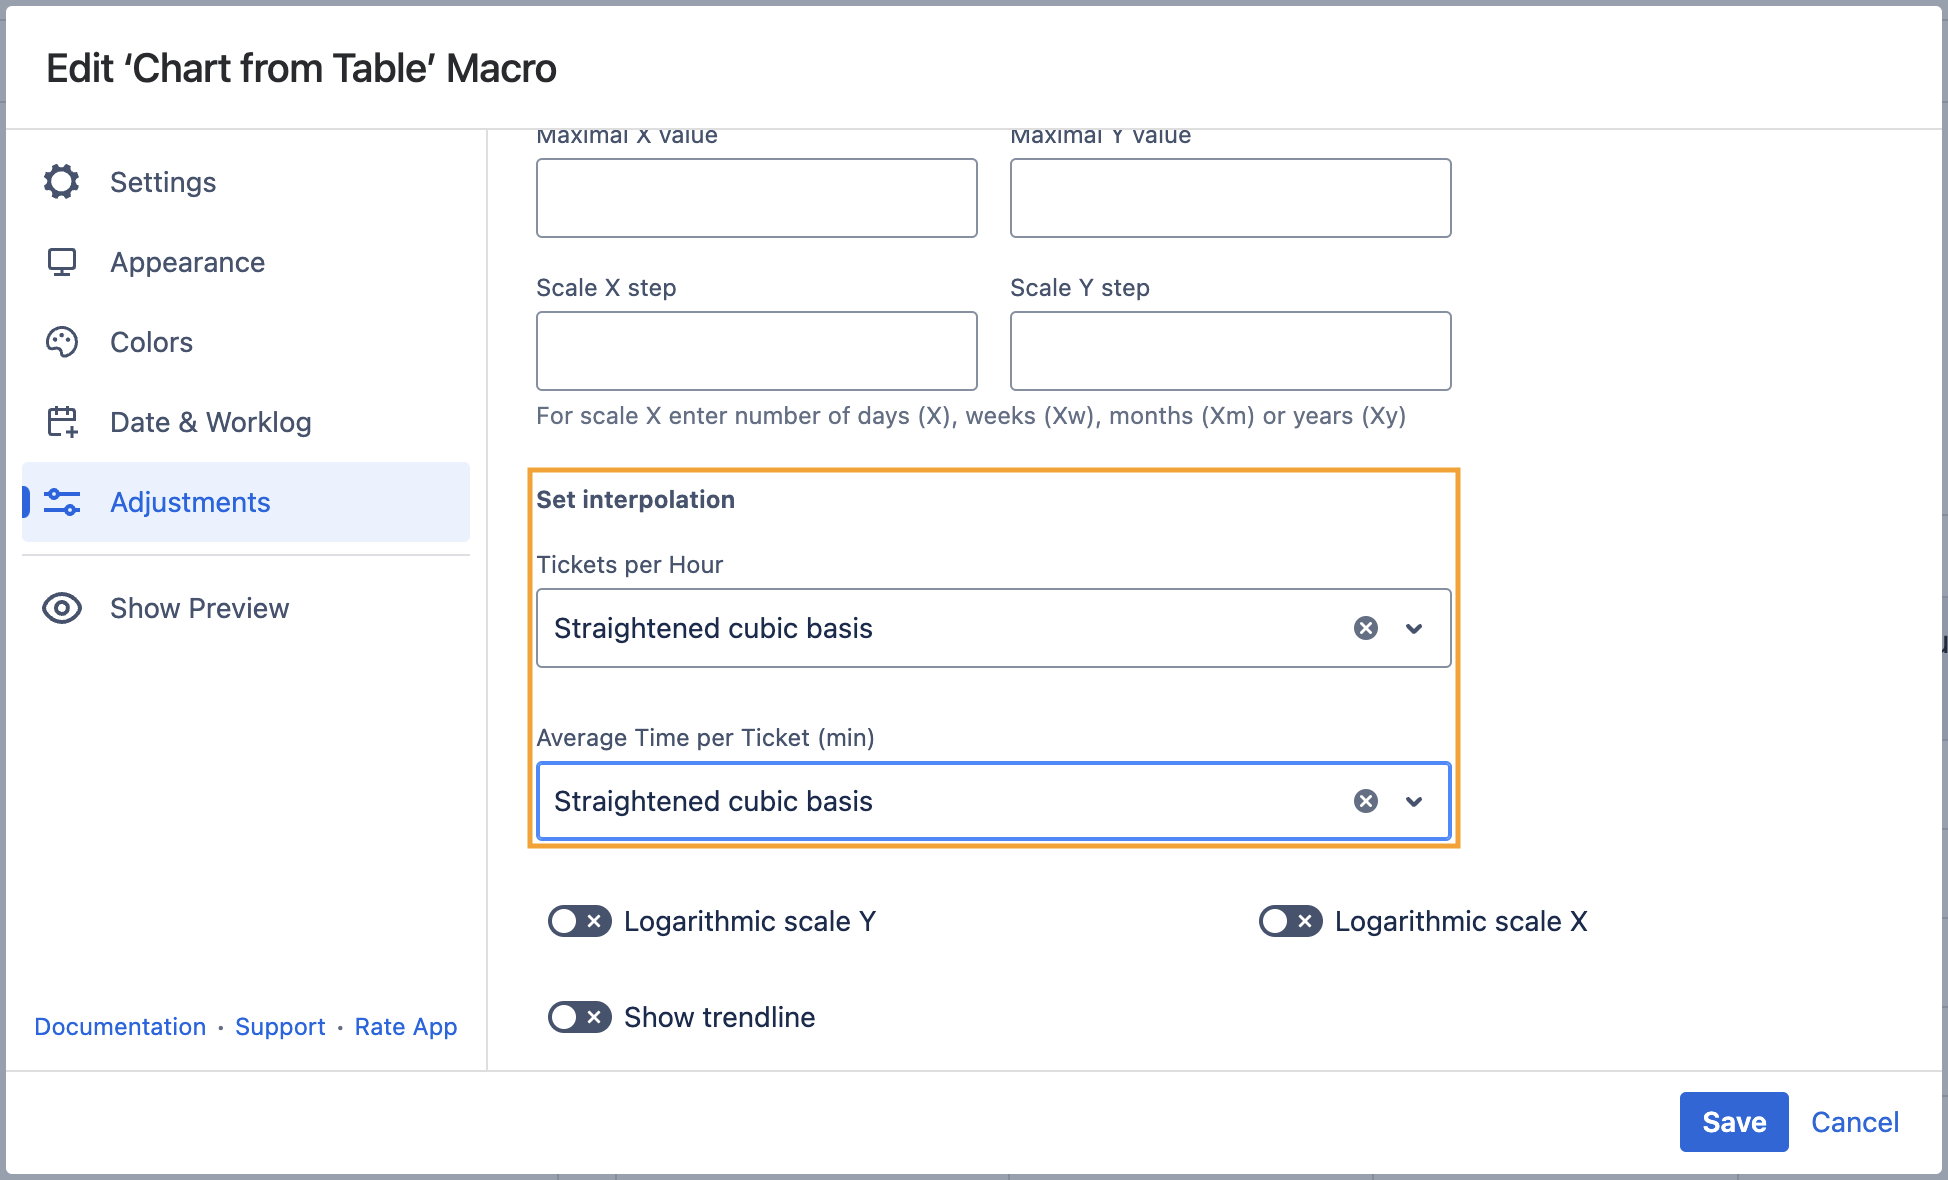
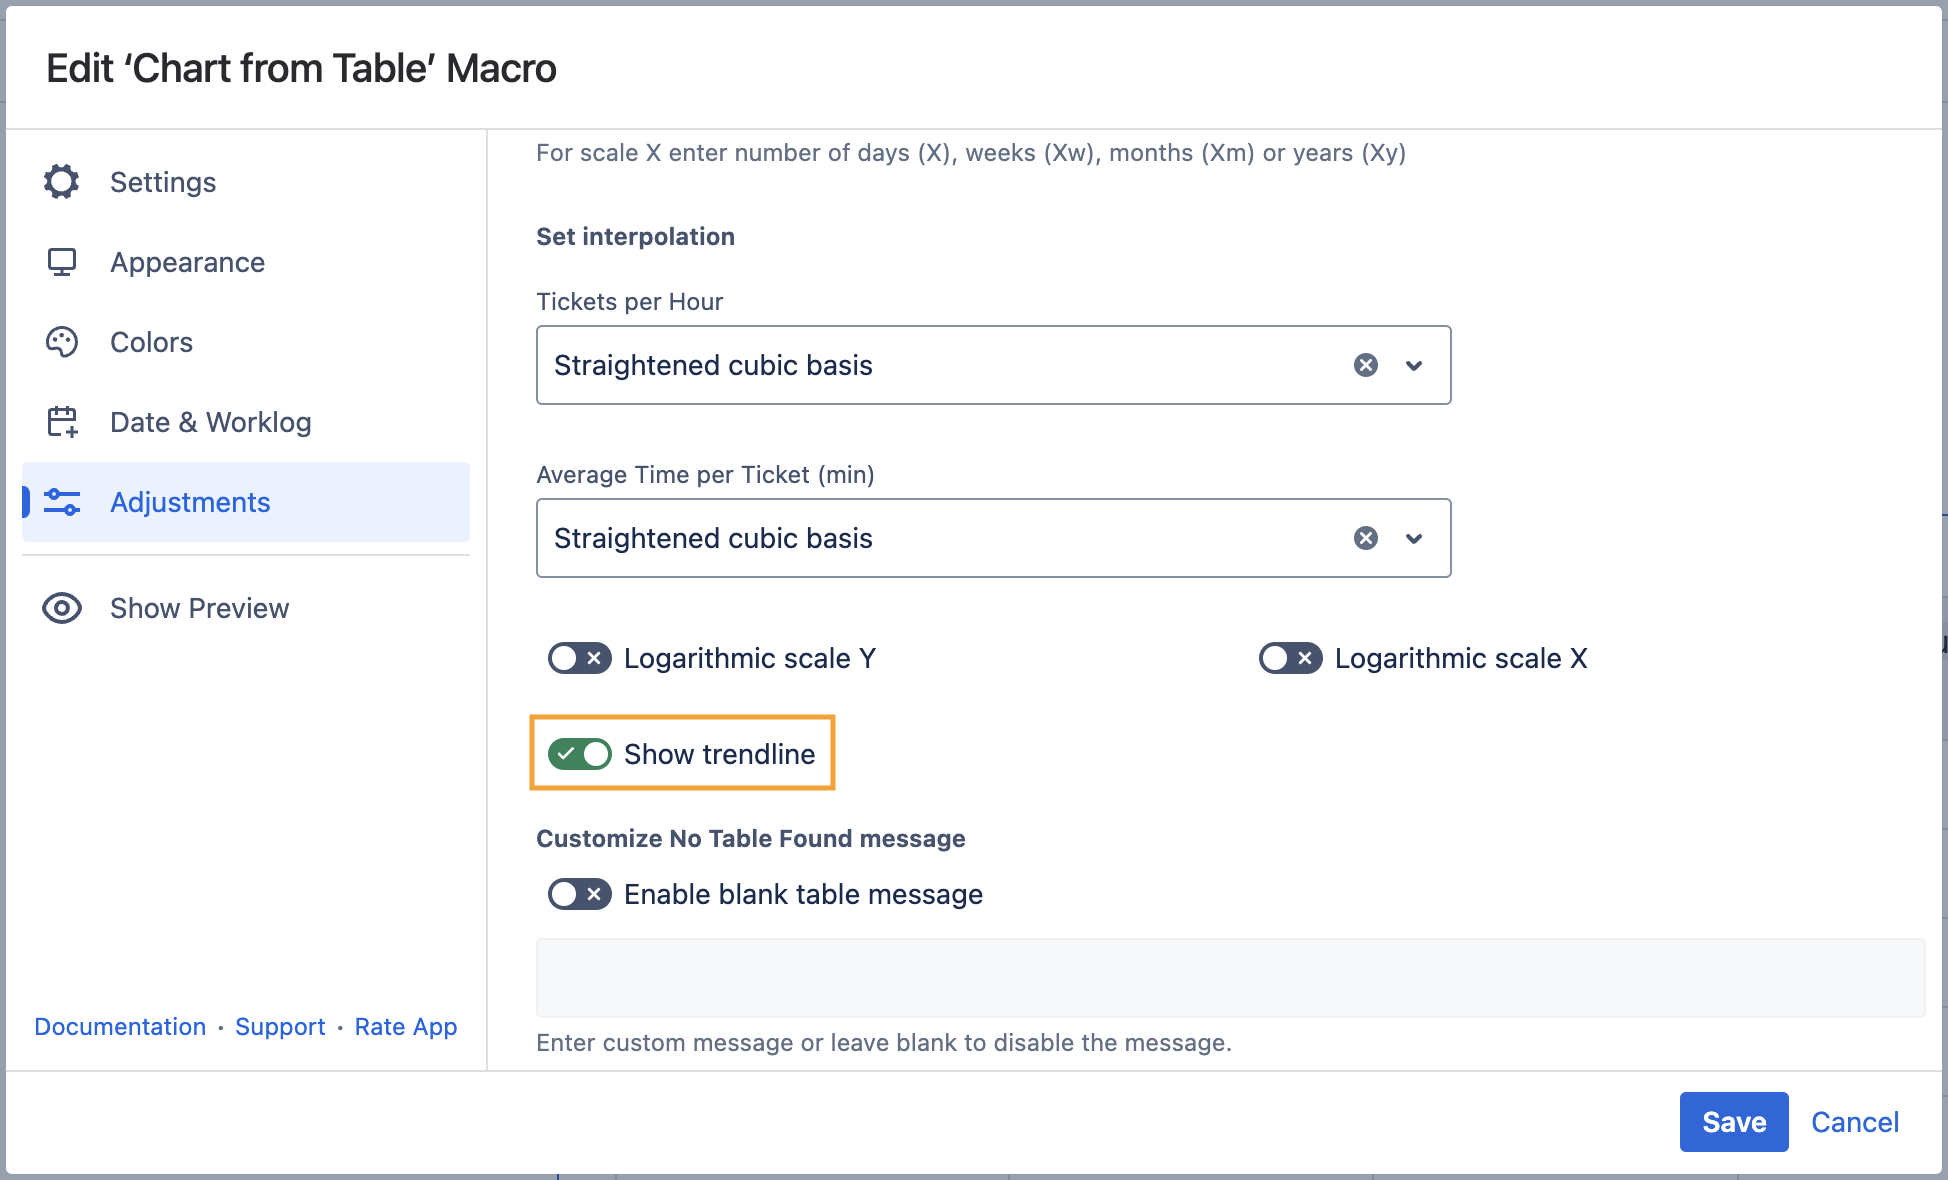
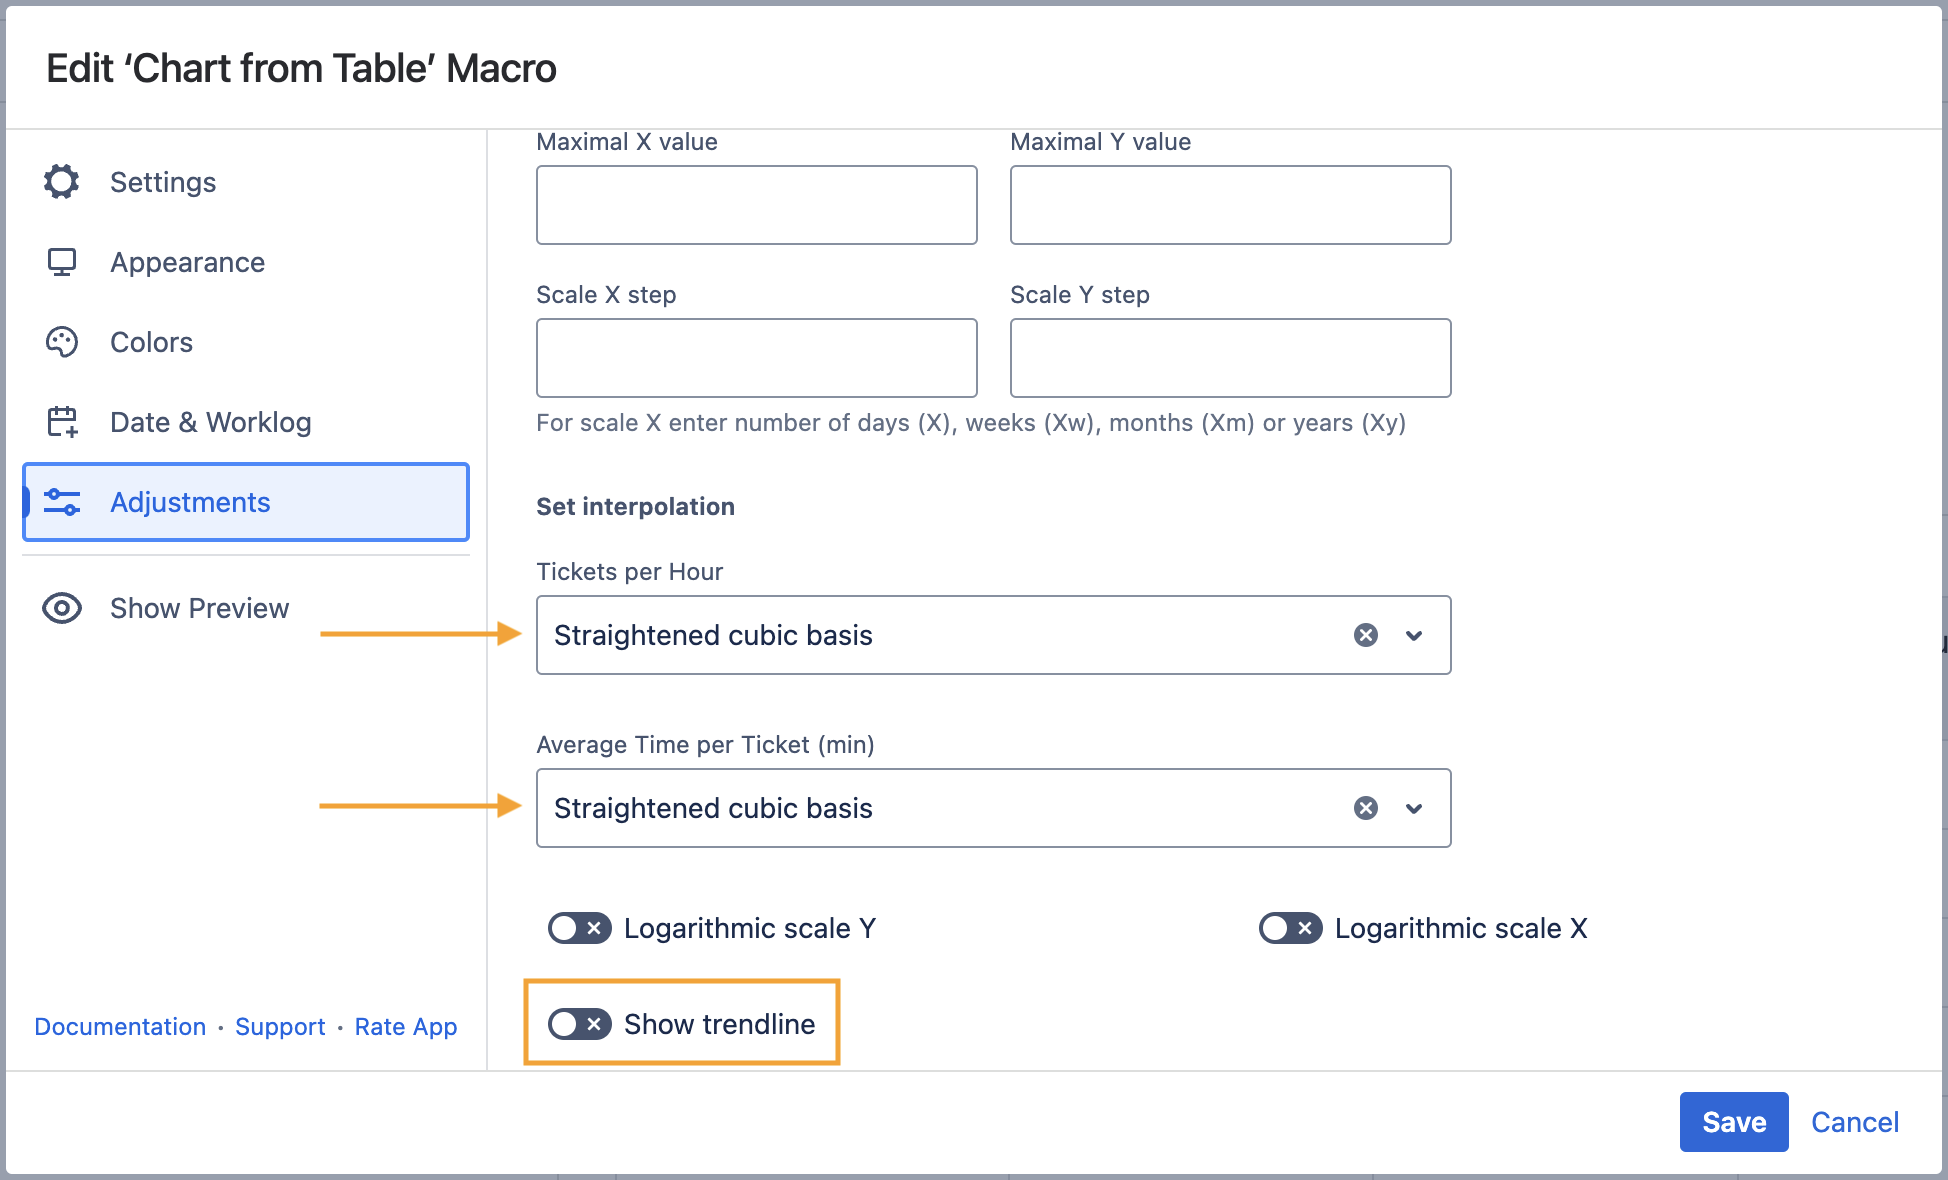
Set the interpolation
- Switch the page to the edit mode.
- Select the macro and click Edit.
- Switch to the Adjustments tab.
- Locate and select the Interpolation method for each line in your chart:
- Linear
- Step
- Natural cubic
- Monotone X cubic
- Monotone Y cubic
- Cubic Catmull-Rom
- Cubic cardinal
- Cubic basis
- Straightened cubic basis
- Save the macro and the page.
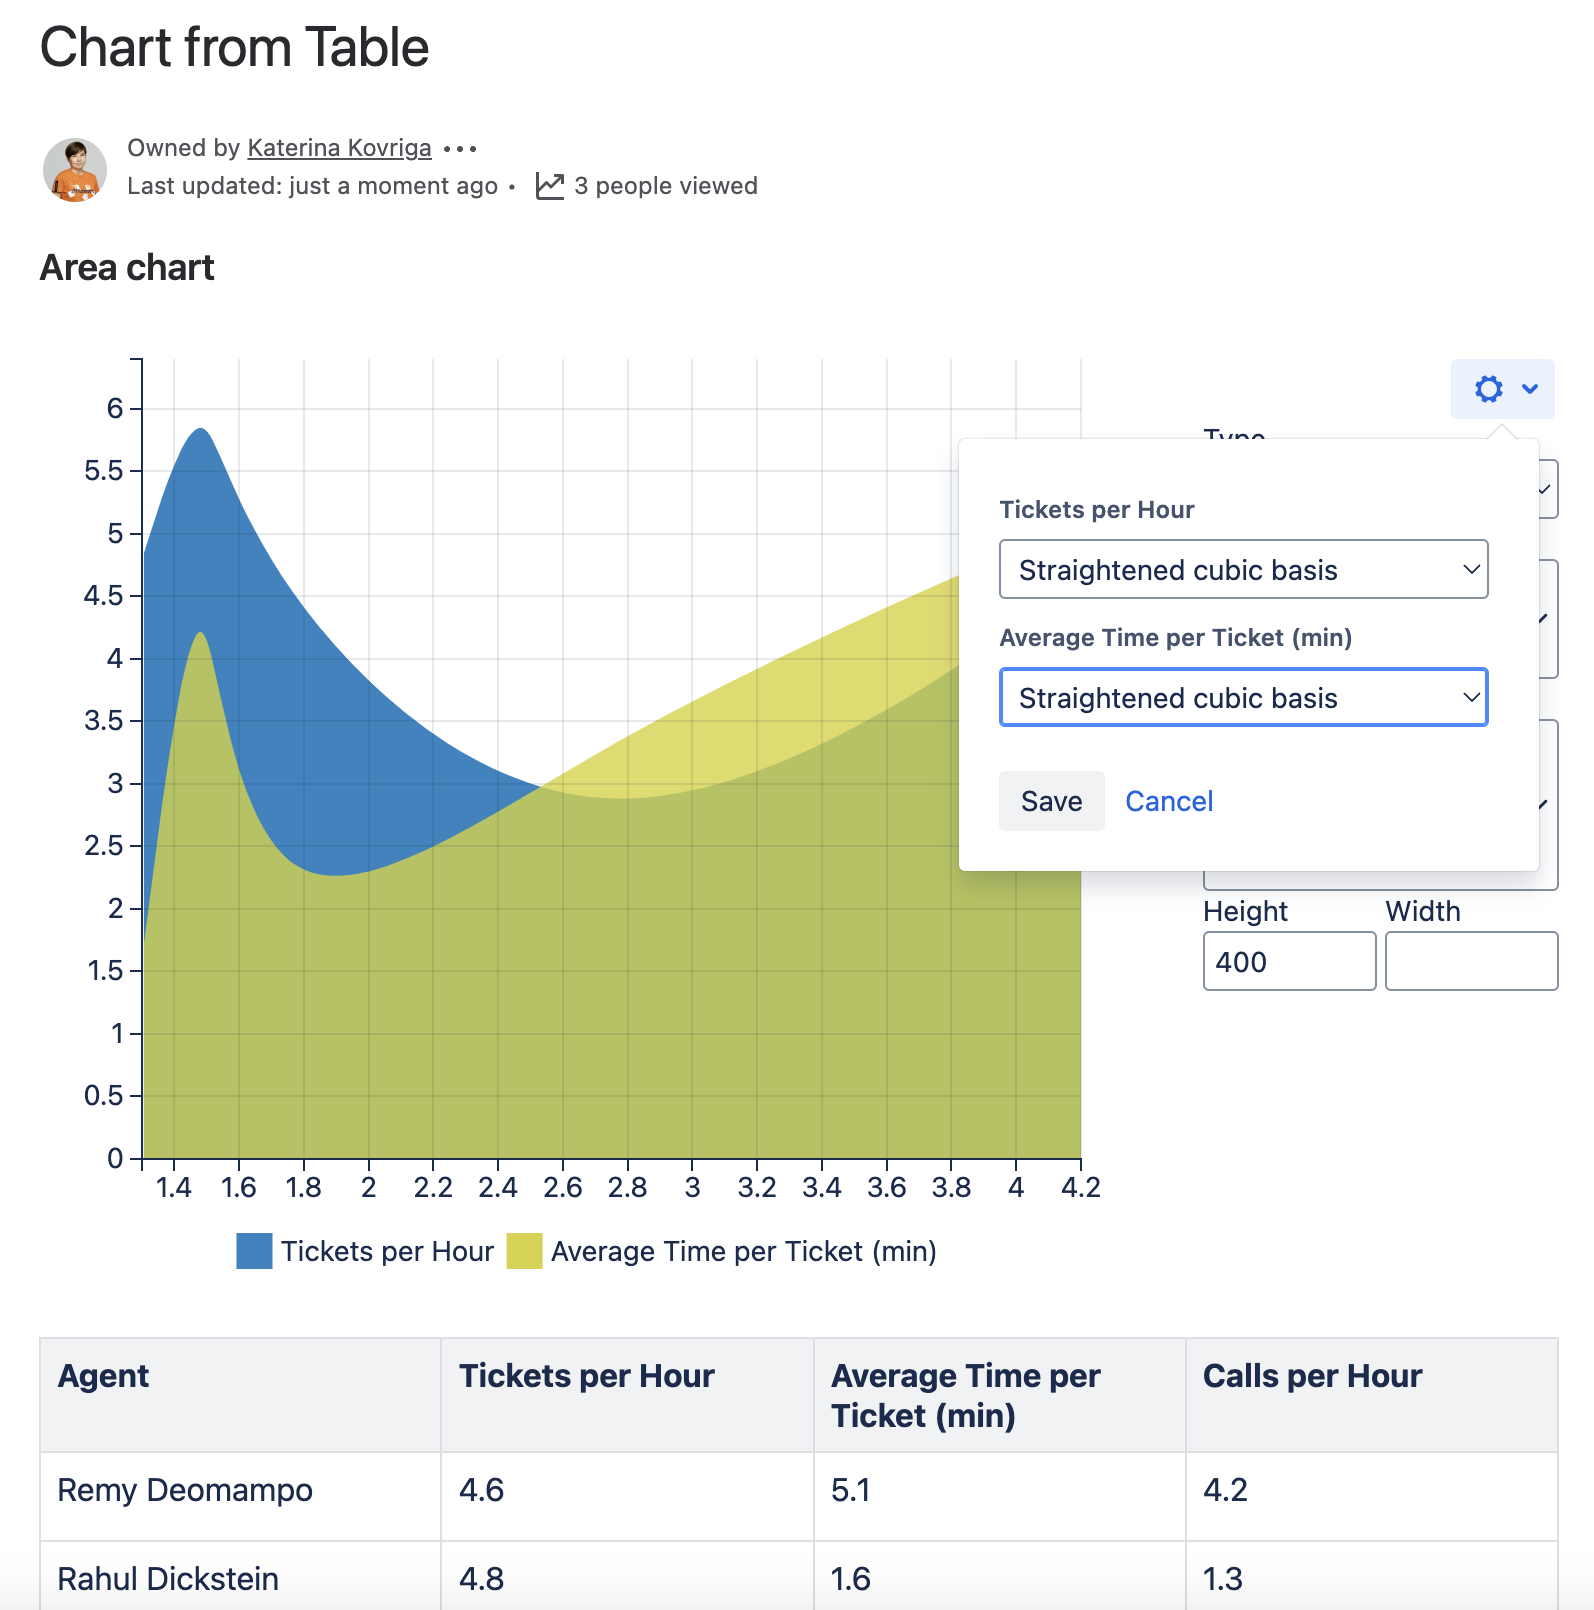
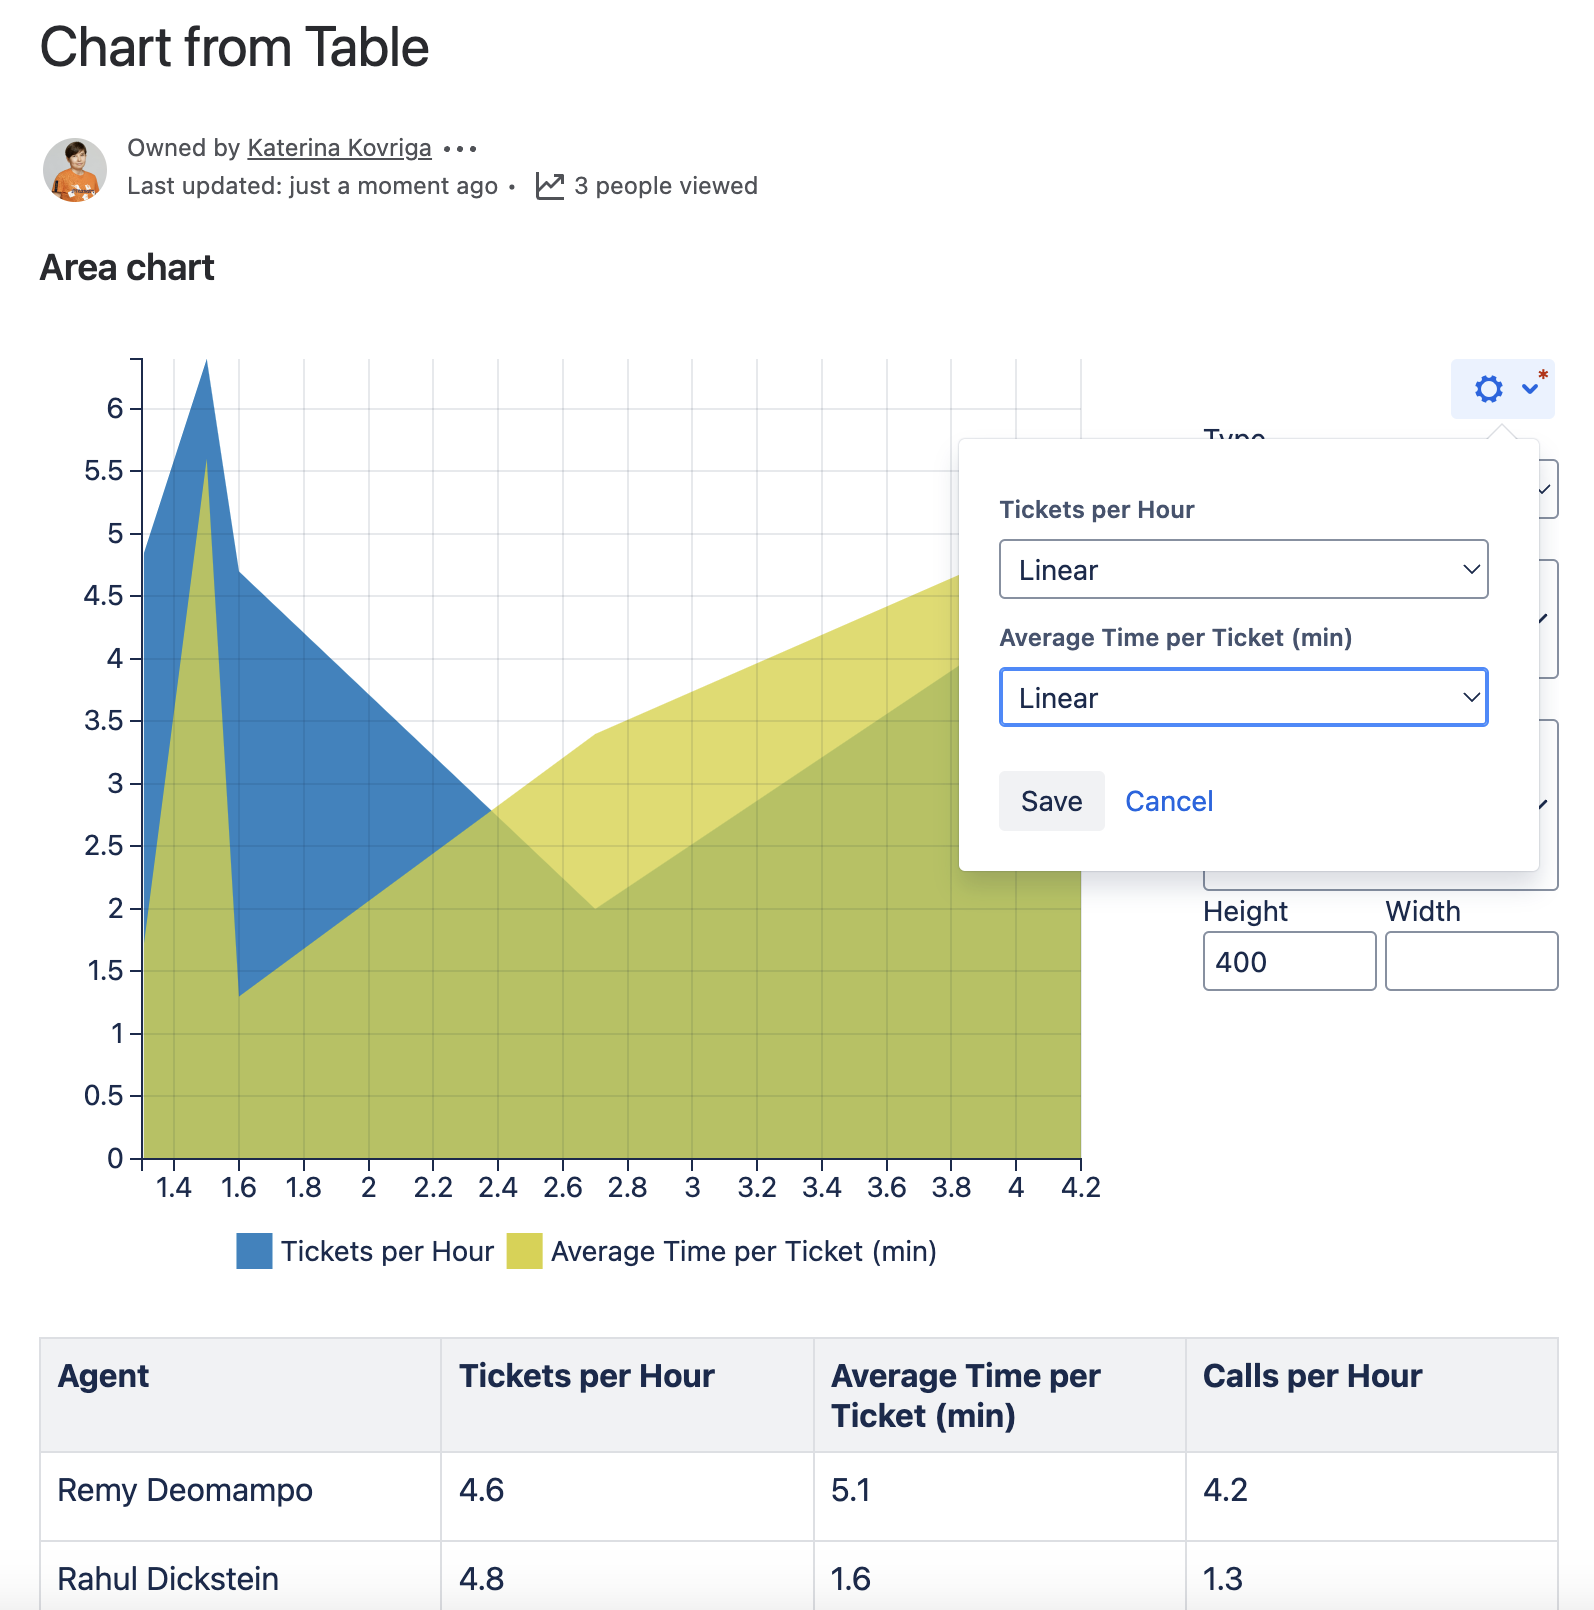
To set the interpolation in the page view mode:
- Hover over the chart controls on the right of the table.
Click the cogwheel icon, select the Set interpolation option and choose the method. The chart will be automatically regenerated.
To save the modifications in the macro body, click the cogwheel icon and select Save changes.
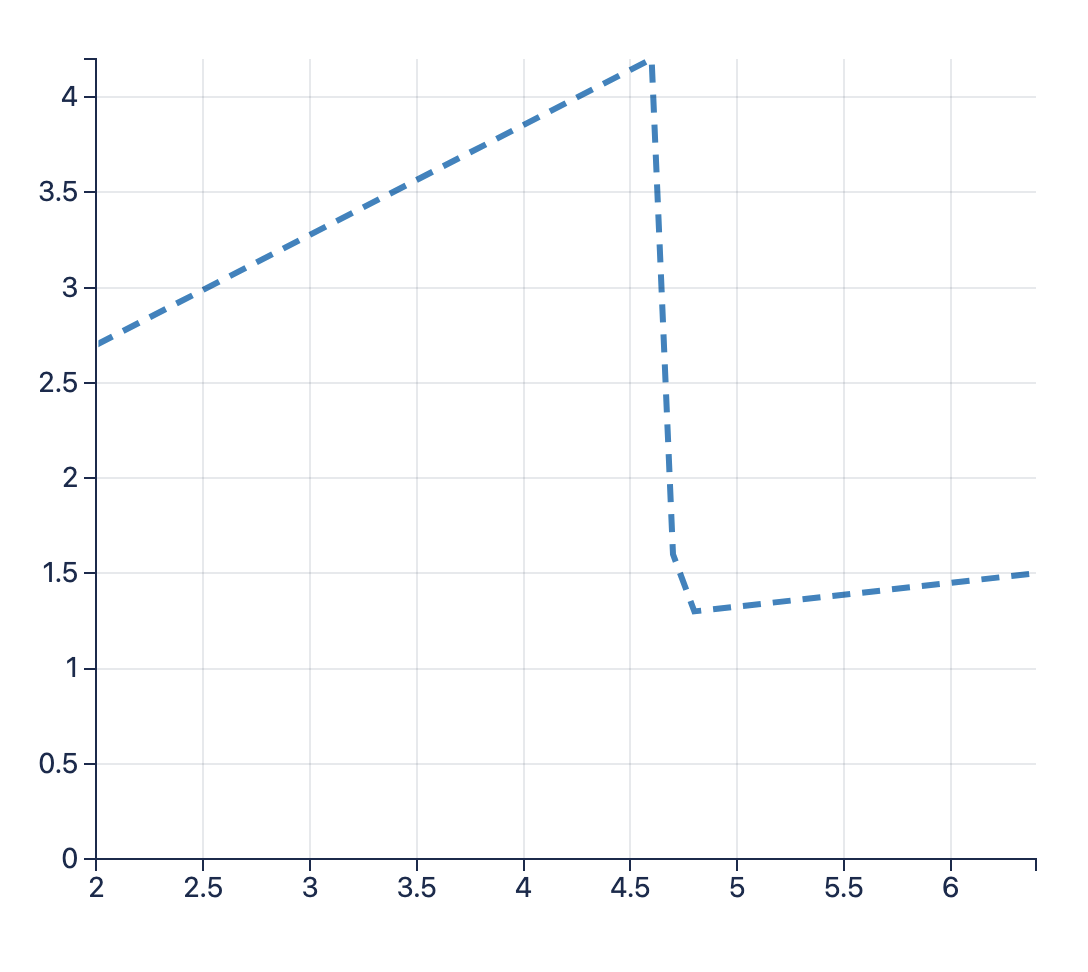
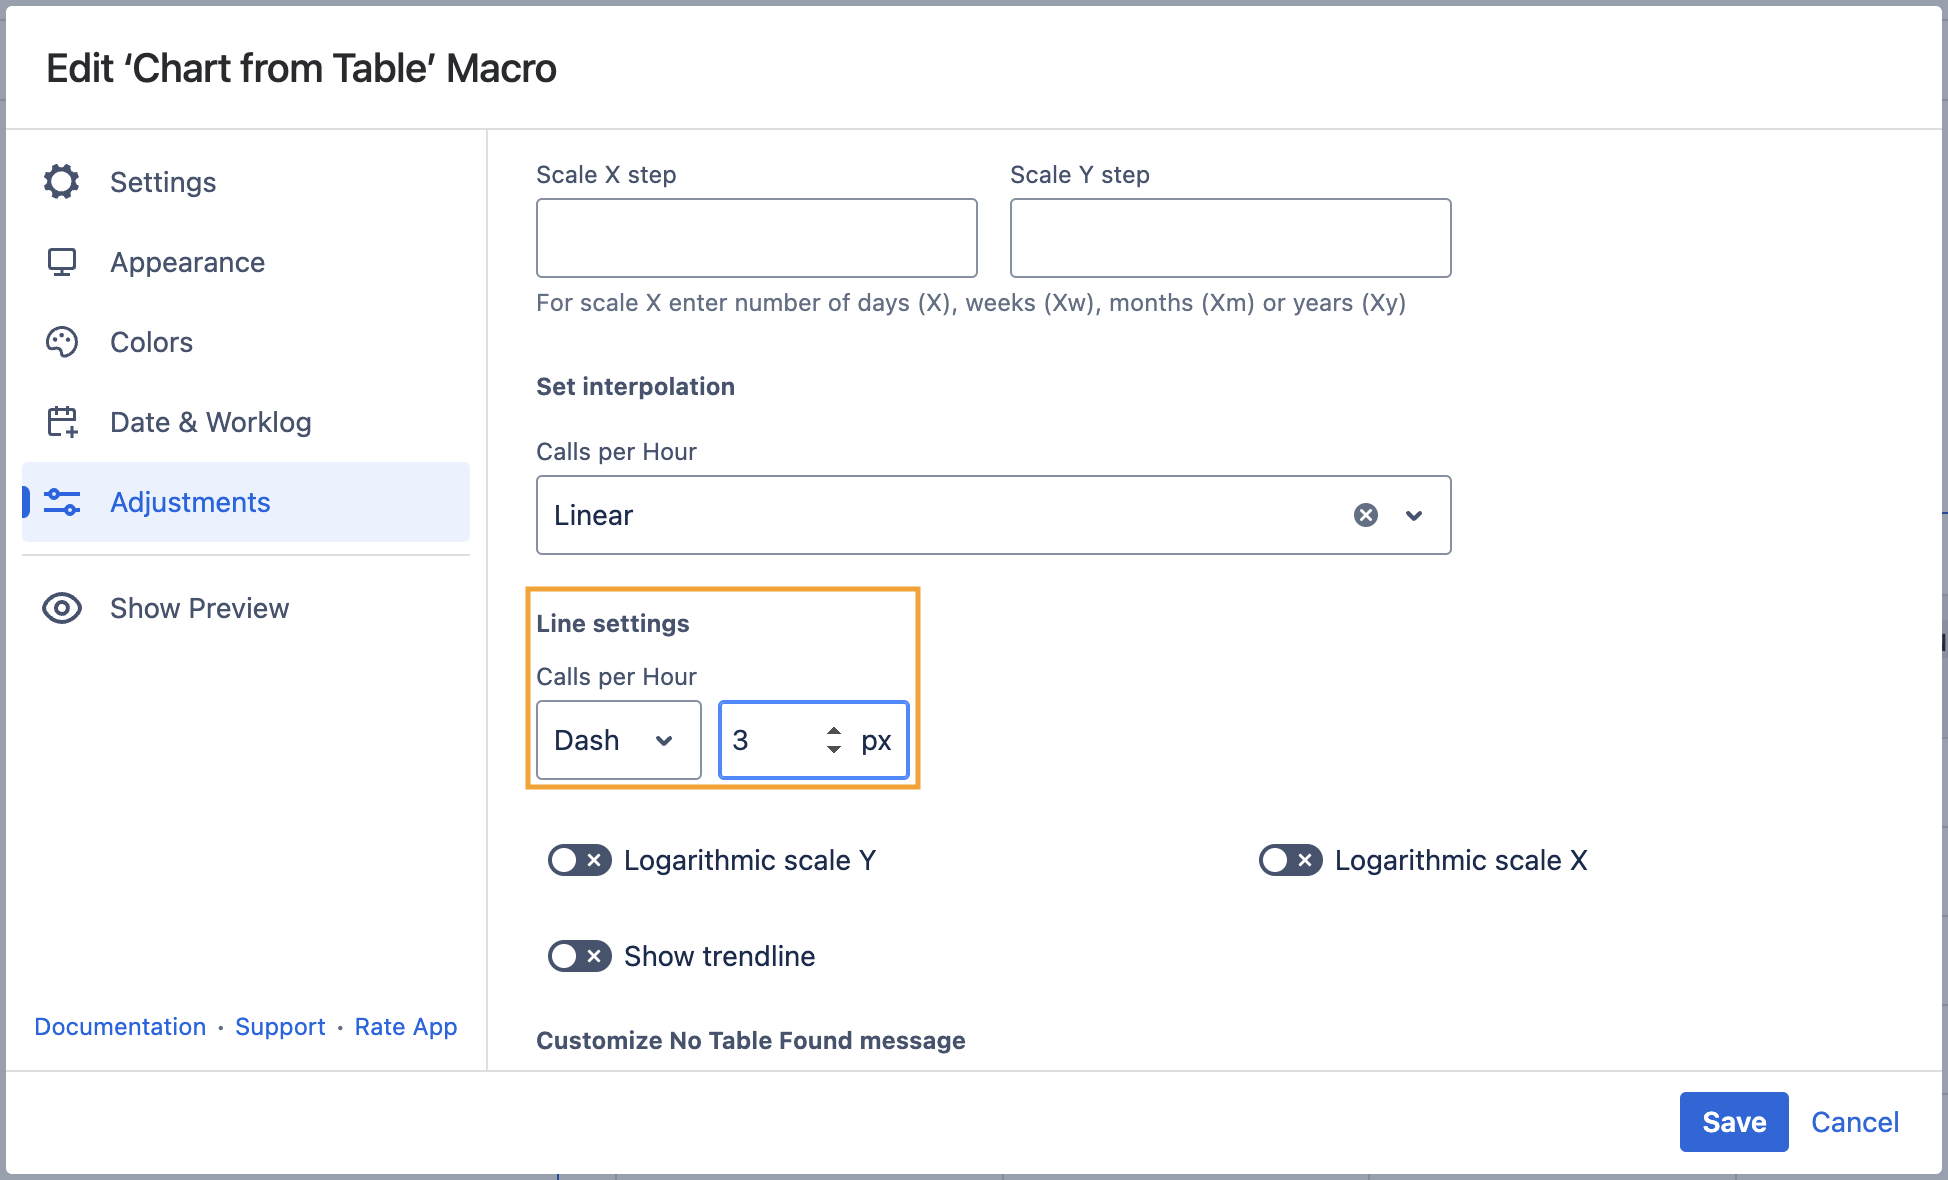
Set the line type settings
- Switch the page to the edit mode.
- Select the macro and click Edit.
- Switch to the Adjustments tab.
- Configure the line type (solid, dash, dot) and widths (in pixels) settings for each line in your chart.
- Save the macro and the page.
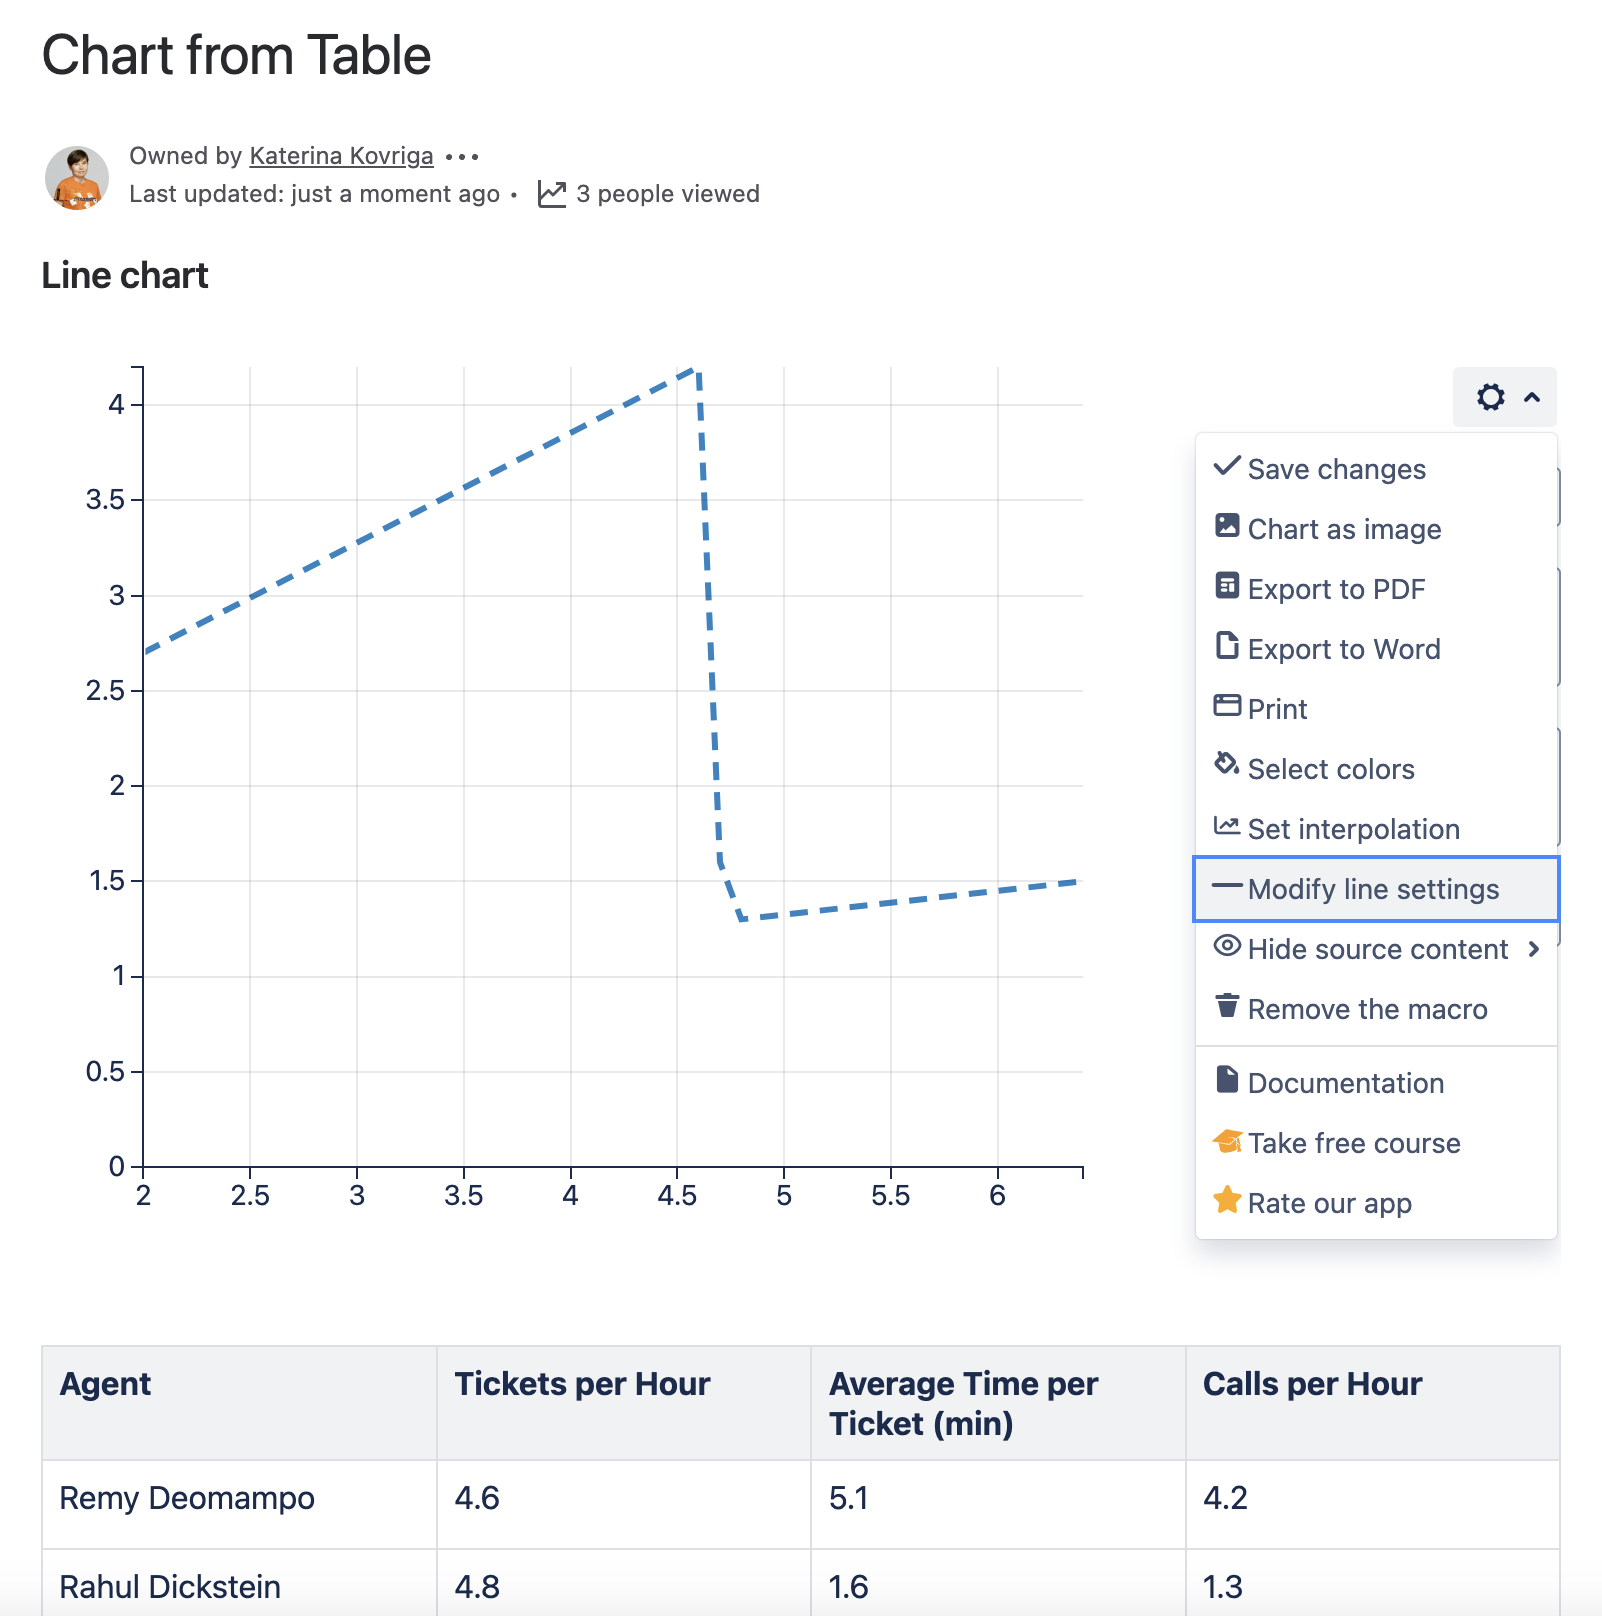
To set the line settings in the page view mode:
- Hover over the chart controls on the right of the table.
- Click the cogwheel icon, select the Modify line settings option. After modifying settings click Save. The chart will be automatically regenerated.
- To save the modifications in the macro body, click the cogwheel icon and select Save changes.
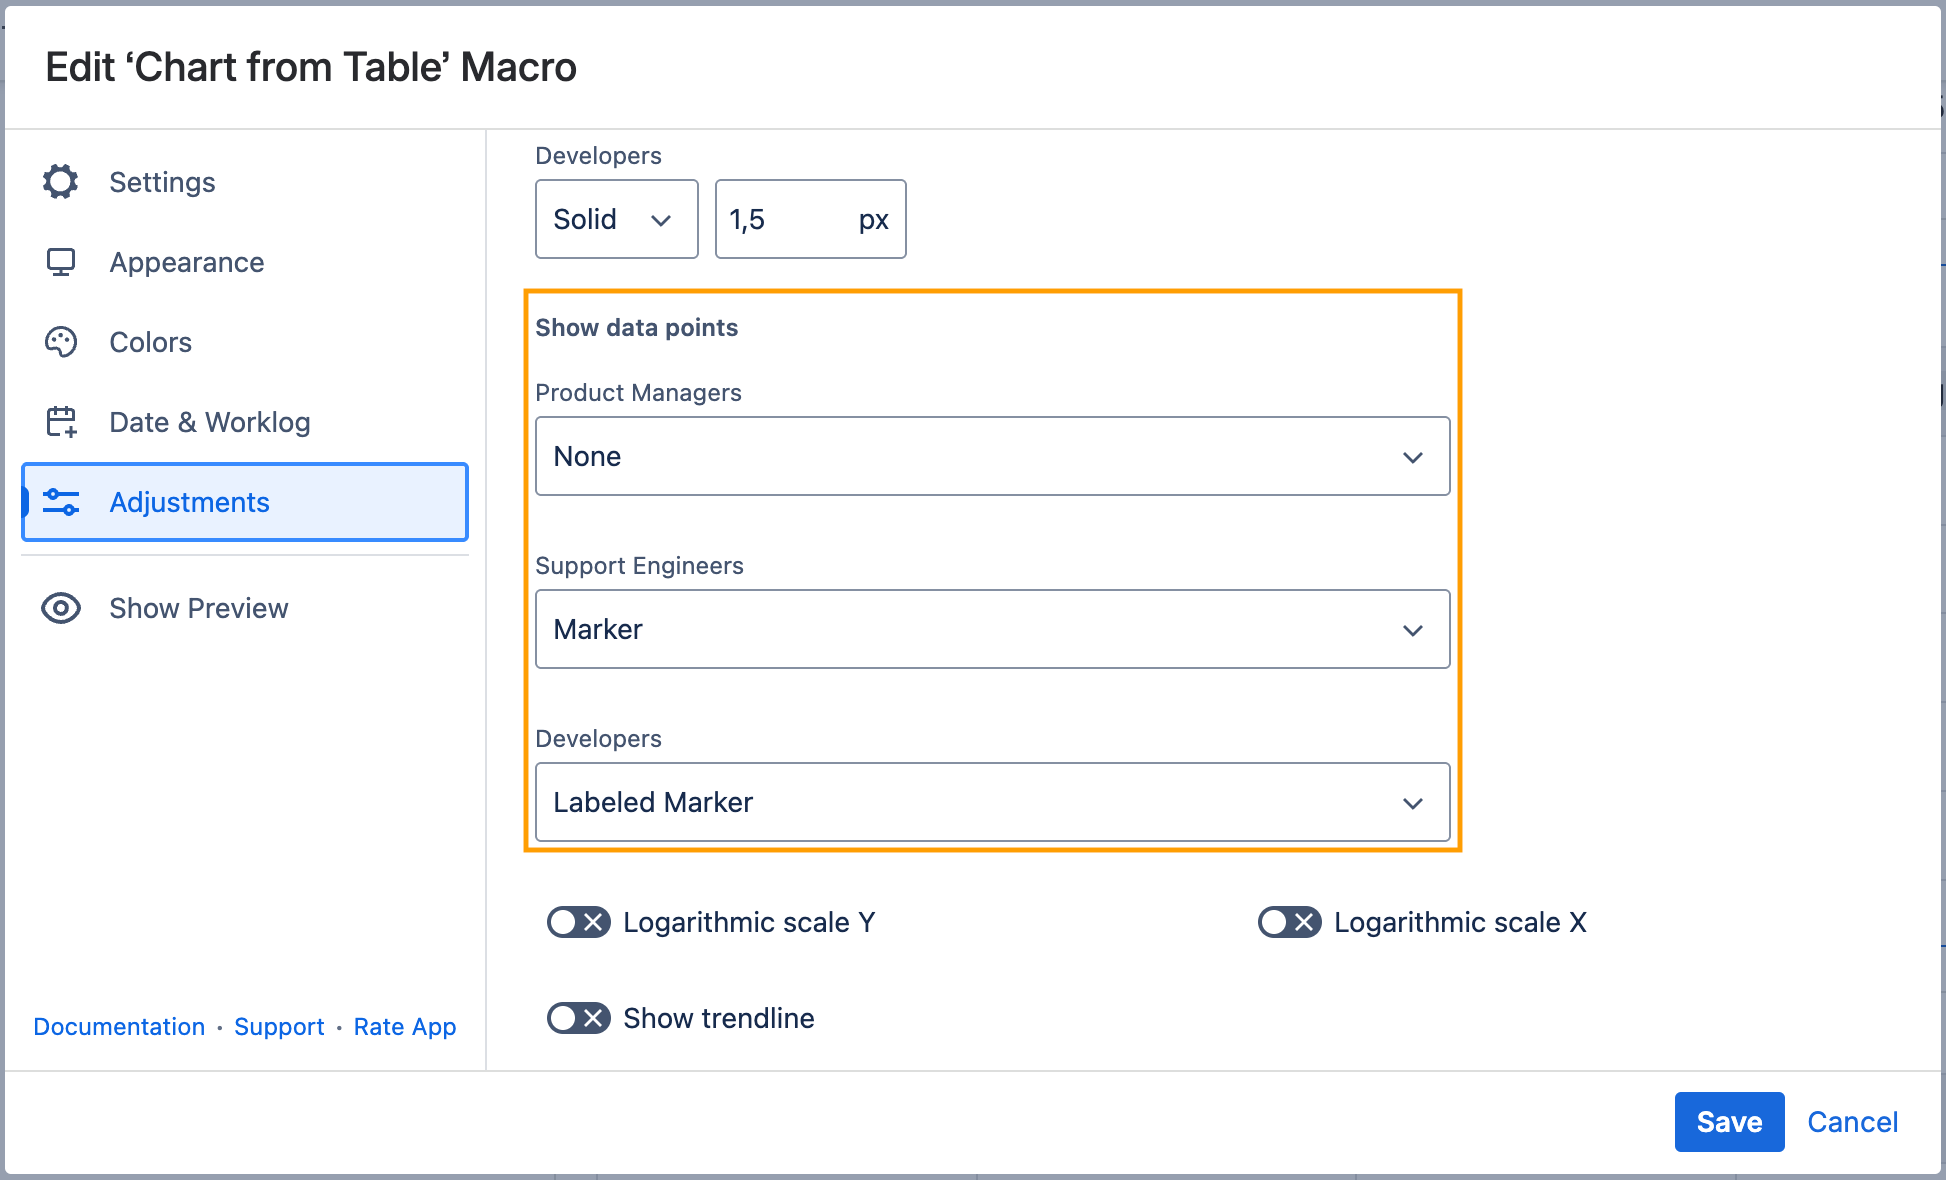
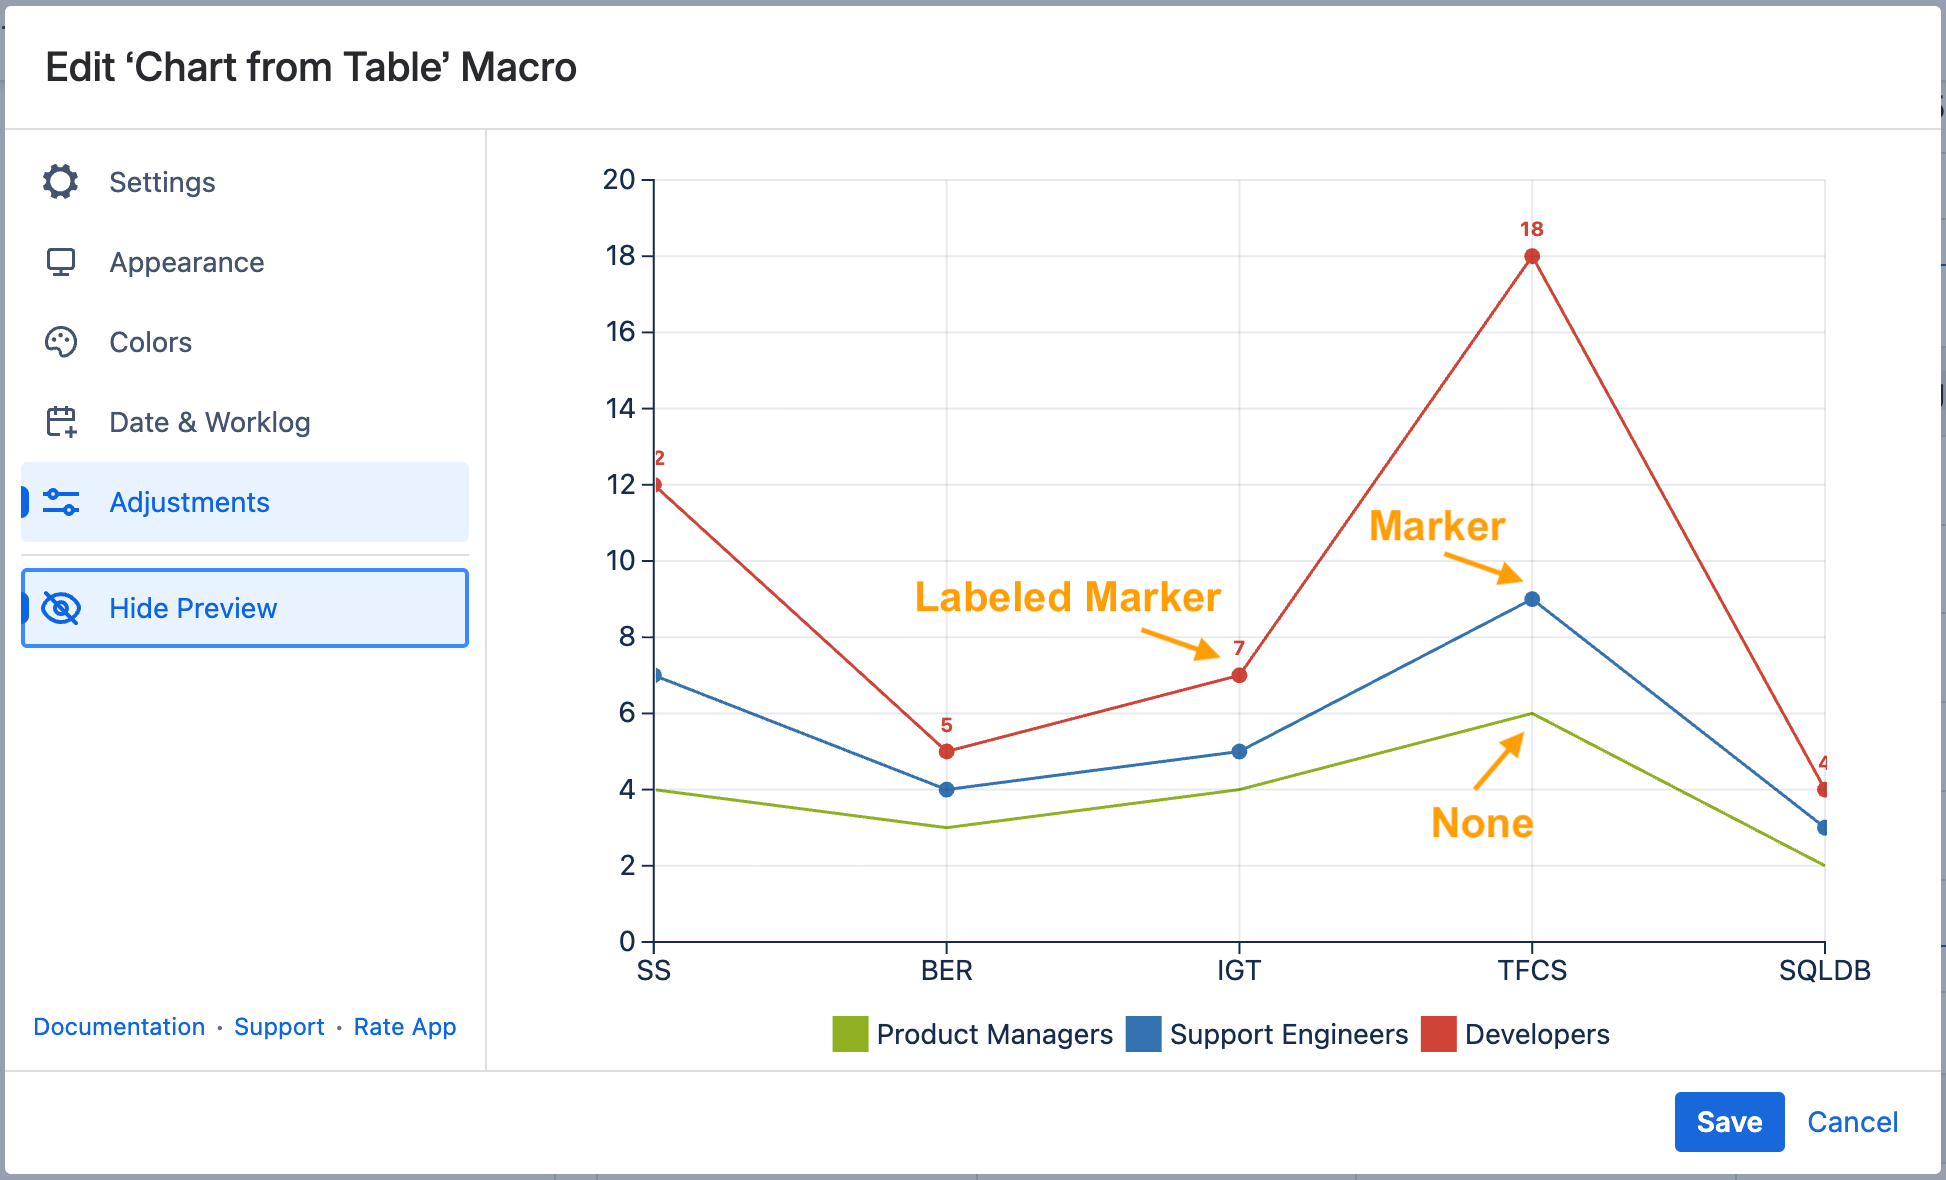
Set the type of data points
(For Line chart)
- Switch the page to the edit mode.
- Select the macro and click Edit.
- Switch to the Adjustments tab.
- Locate the Show data points option and select one of the following:
None - displays a plain line without markers or labels.
Marker - adds visible points to highlight data values.
Labeled Marker - adds points with value labels for clearer insights. - Save the macro and the page.
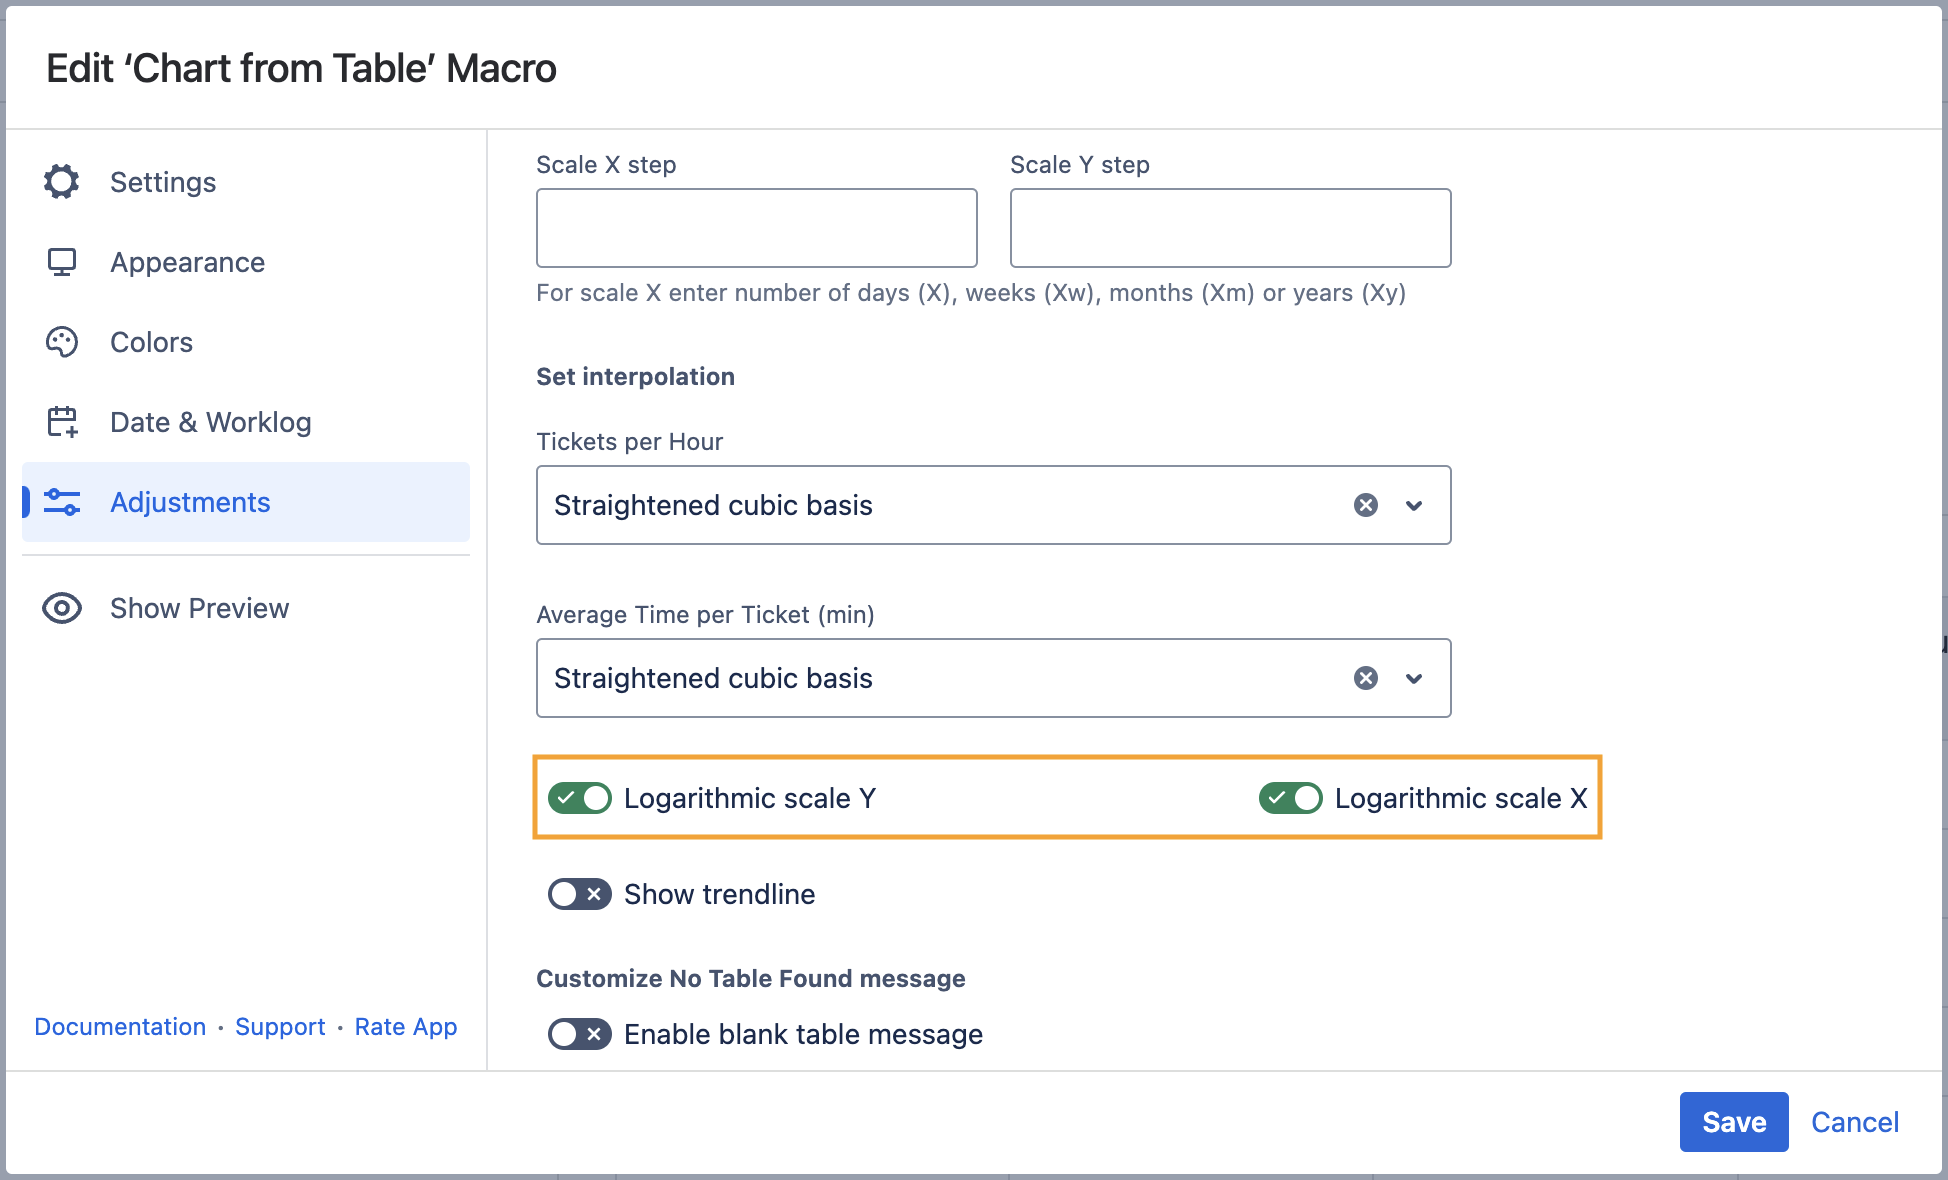
Set the logarithmic scale
Logarithmic scale X - the option for very small or very large numeric values that cannot be properly aligned on the standard arithmetic scale.
Logarithmic scale Y - the option for very small or very large numeric values that cannot be properly aligned on the standard arithmetic scale.
- Switch the page to the edit mode.
- Select the macro and click Edit.
- Switch to the Adjustments tab.
- Locate the Logarithmic scale X (Y) options and enable the option.
- Save the macro and the page.
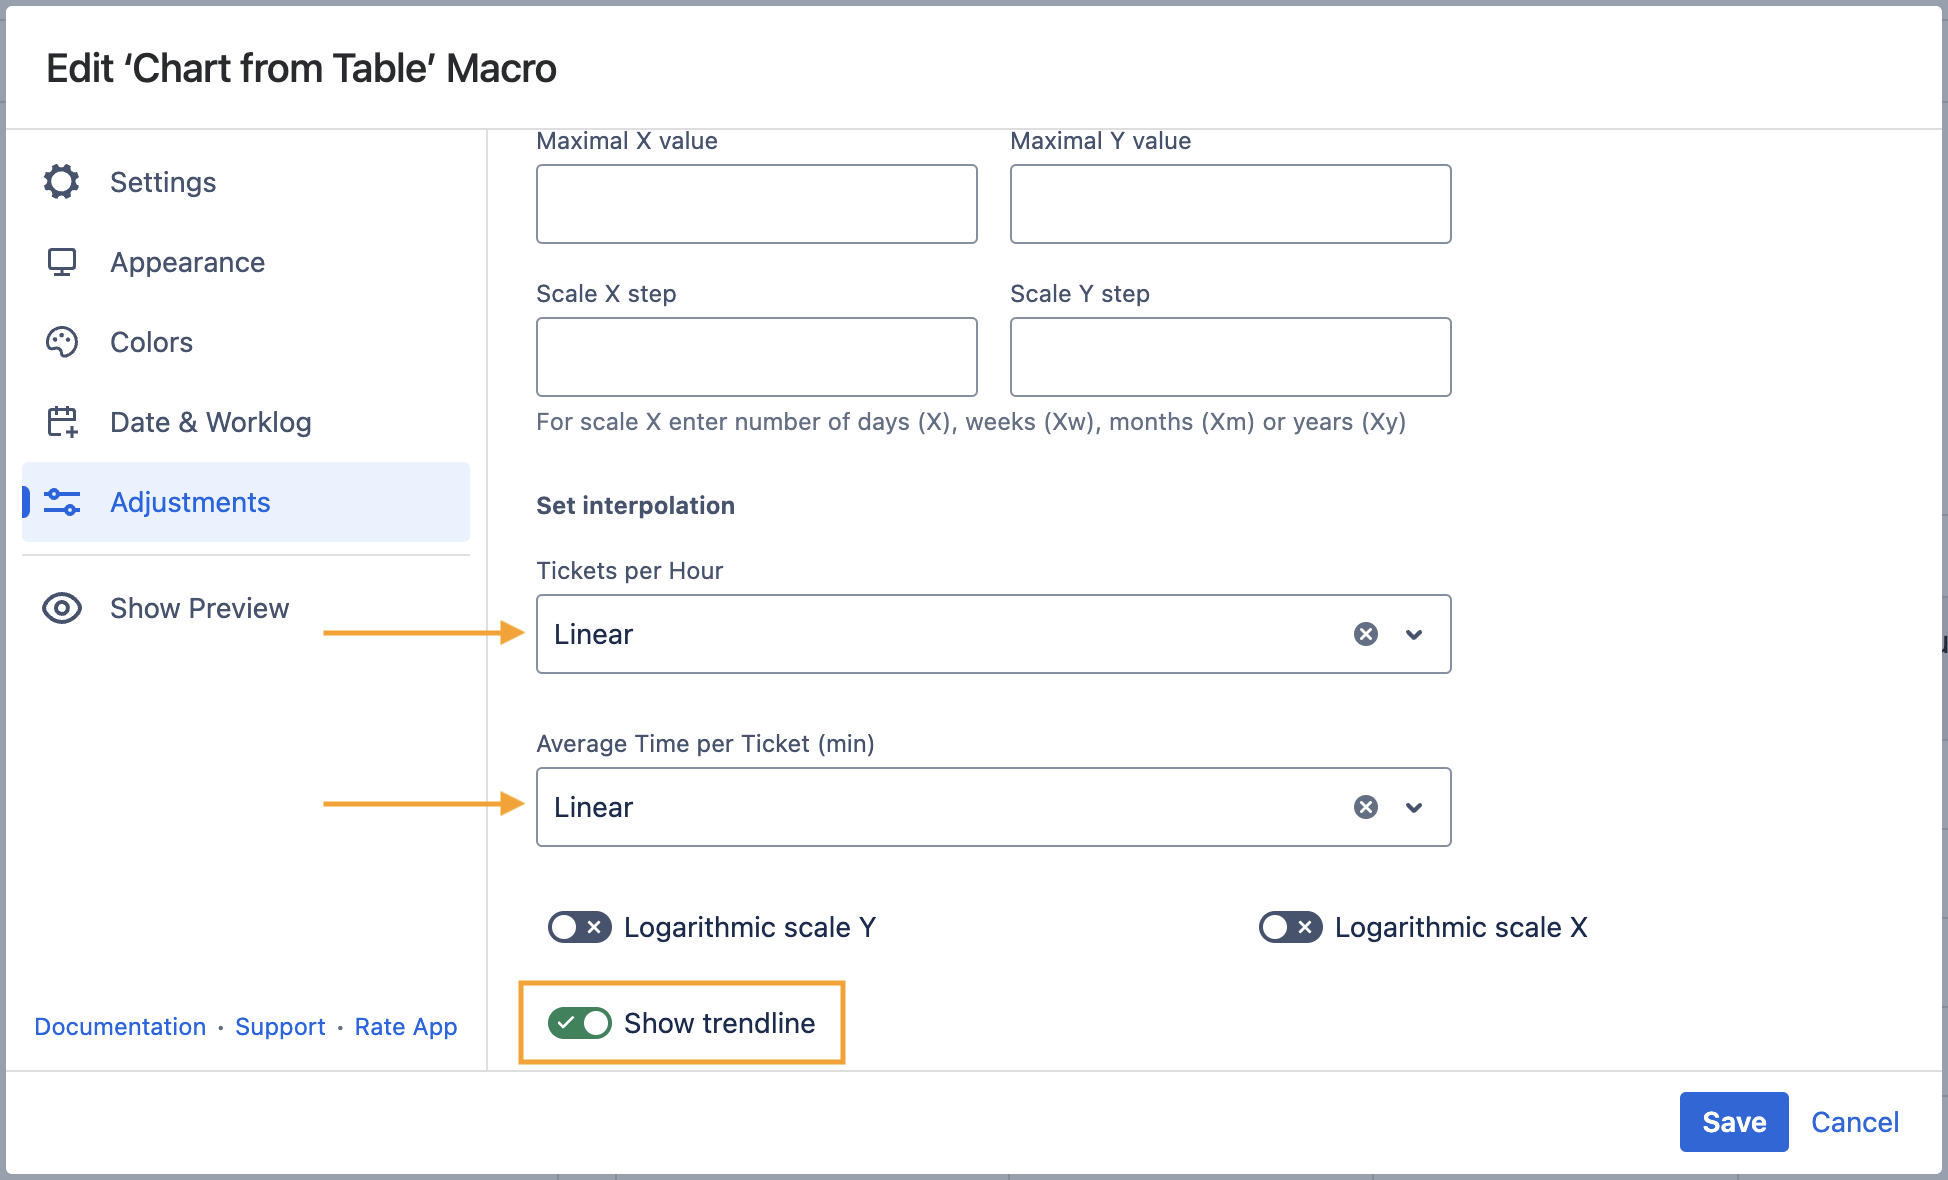
Show trendline
- Switch the page to the edit mode.
- Select the macro and click Edit.
- Switch to the Adjustments tab.
- Locate and enable the Show trendline option.
- Save the macro and the page.
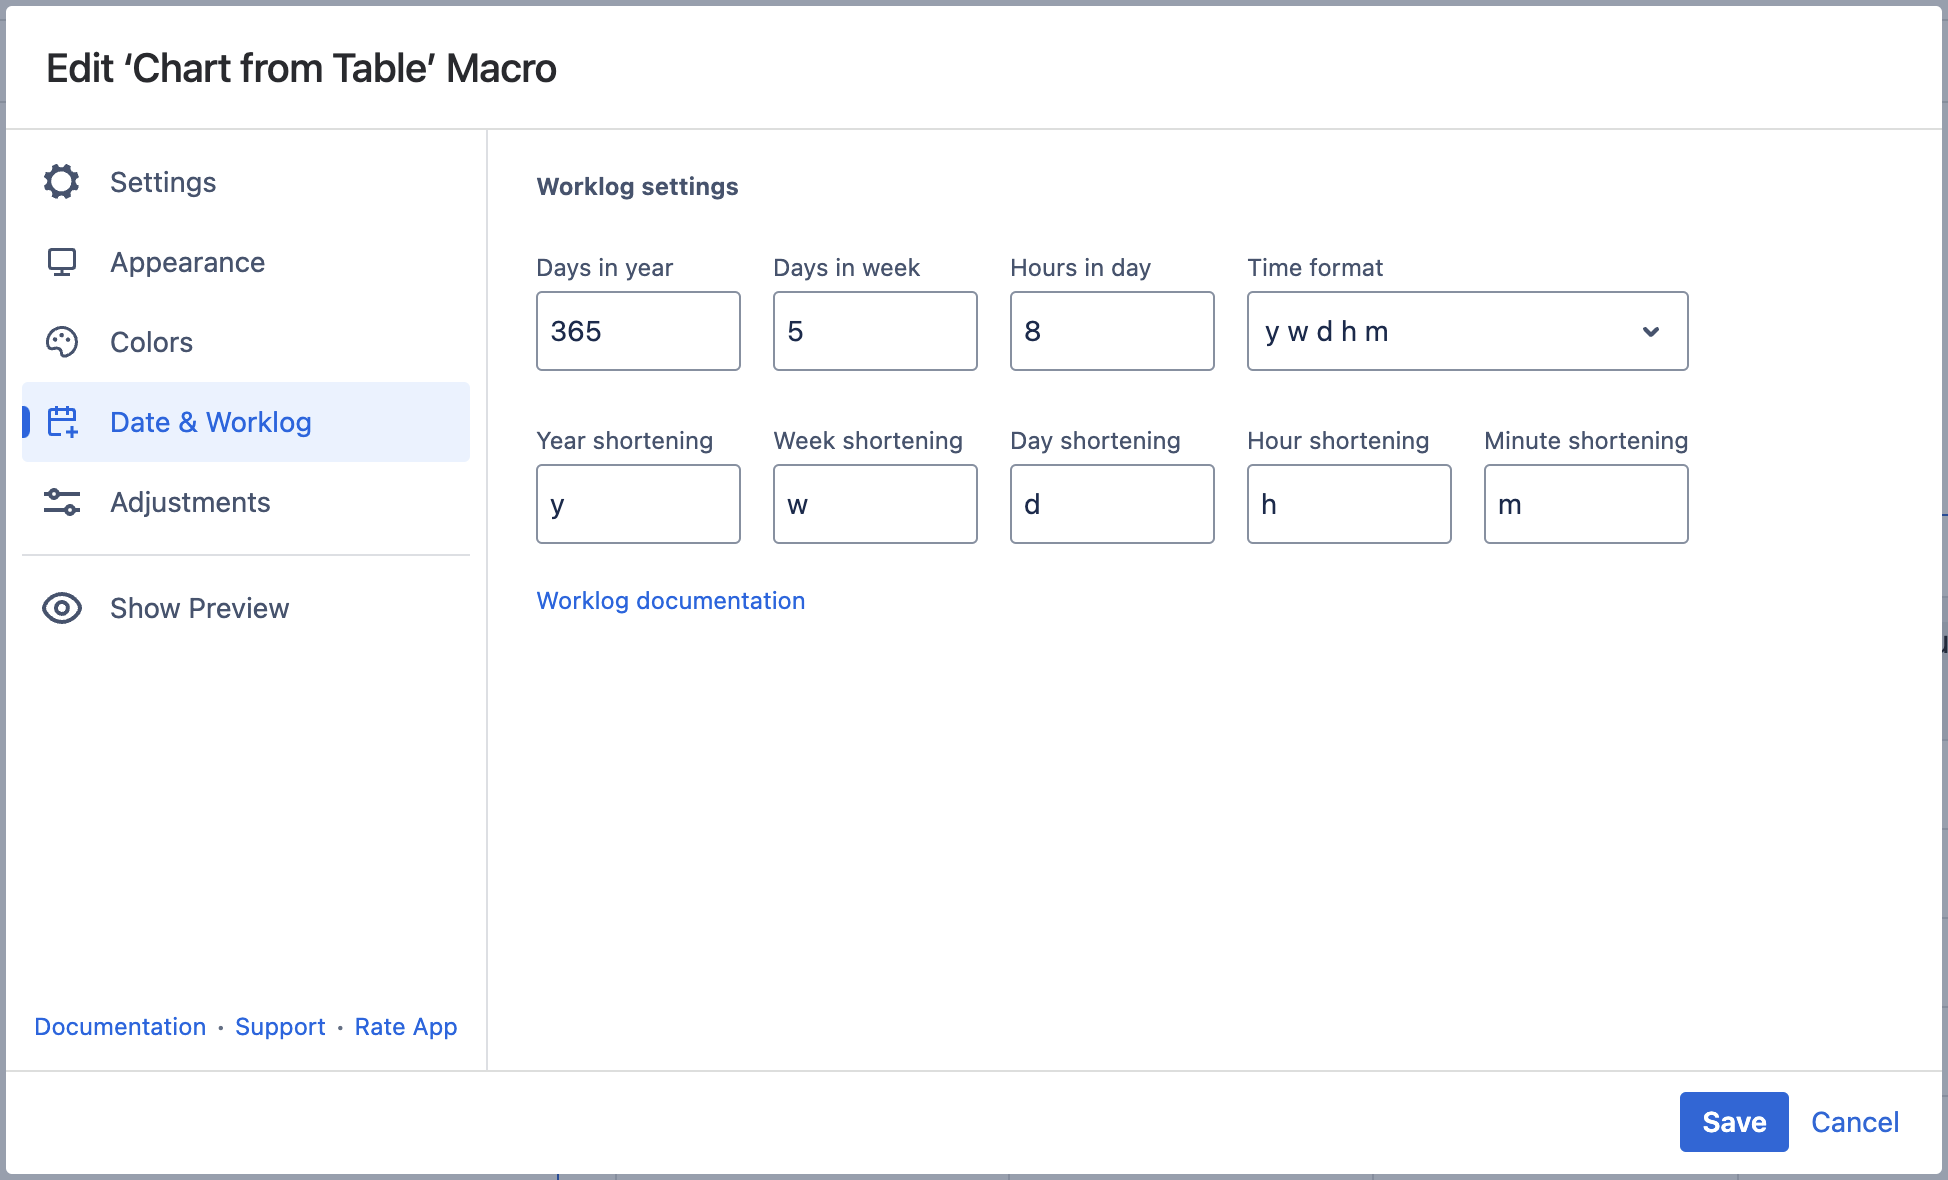
Date & Worklog Tab
Set the worklog settings
- Switch the page to the edit mode.
- Select the macro and click Edit.
- Switch to the Date & Worklog tab.
- Locate the Worklog settings option.
- Define the worklog parameters, as follows:
- Days in year - enter the number of days in a year.
- Days in week - enter the number of business days in a week.
- Hours in day - enter the number of working hours in one business day.
- Time format - select the used time format in worklog values.
- Year shortening - enter the shortening for the year time unit if you use any language different from English.
- Week shortening - enter the shortening for the week time unit if you use any language different from English.
- Day shortening - enter the shortening for the day time unit if you use any language different from English.
- Hour shortening - enter the shortening for the hour time unit if you use any language different from English.
- Minute shortening - enter the shortening for the minute time unit if you use any language different from English.
- Save the macro and the page.
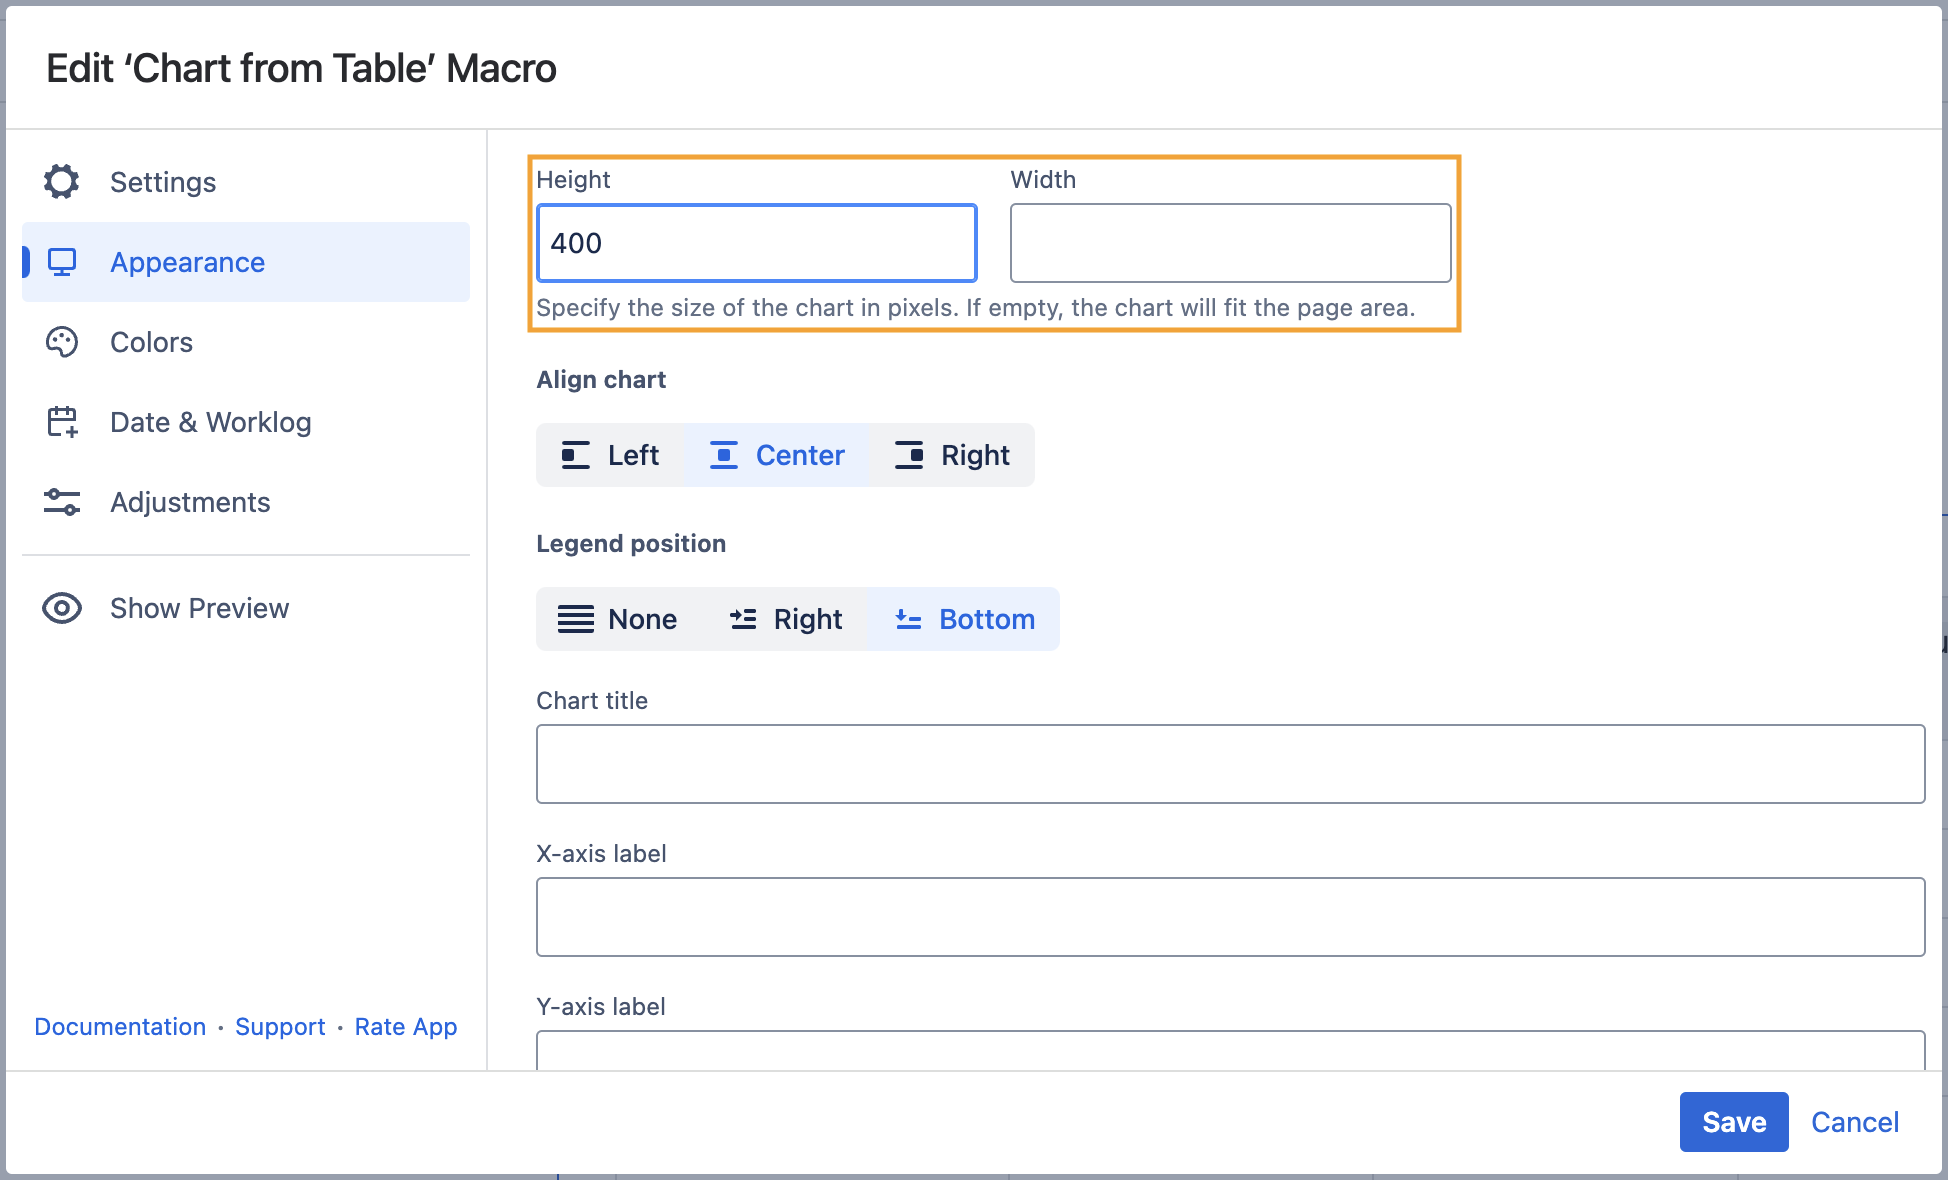
Appearance Tab
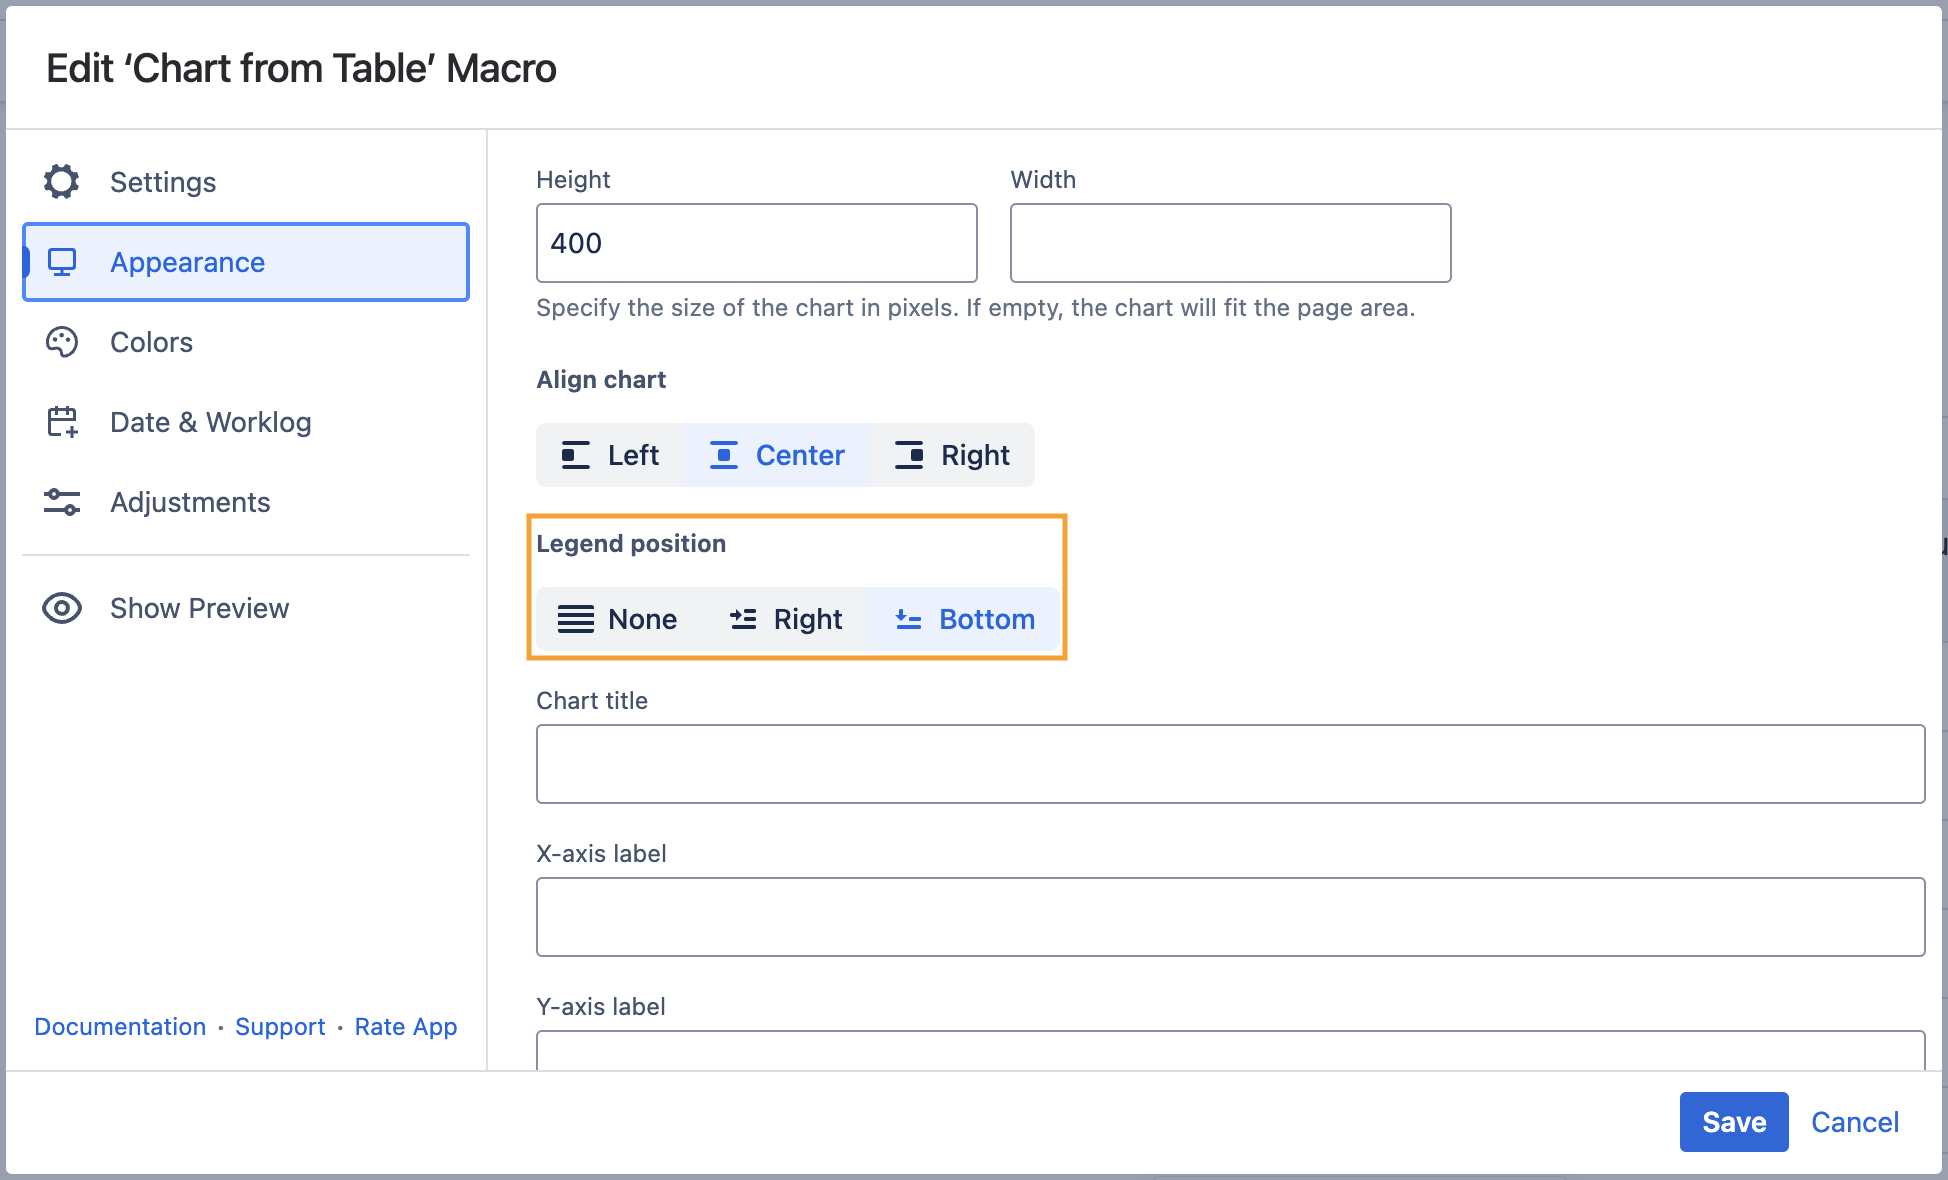
Set the height and width of the chart
- Switch the page to the edit mode.
- Select the macro and click Edit.
- Switch to the Appearance tab.
- Locate the Height and Width fields.
- Enter the appropriate dimensions of the chart.
Save the macro and the page.
To set the Height and Width of the chart in the page view mode:
- Hover over the chart controls on the right of the table.
- Locate the Height and Width fields.
- Enter the appropriate dimensions of the chart.
- To save the modifications in the macro body, click the cogwheel icon and select Save changes.

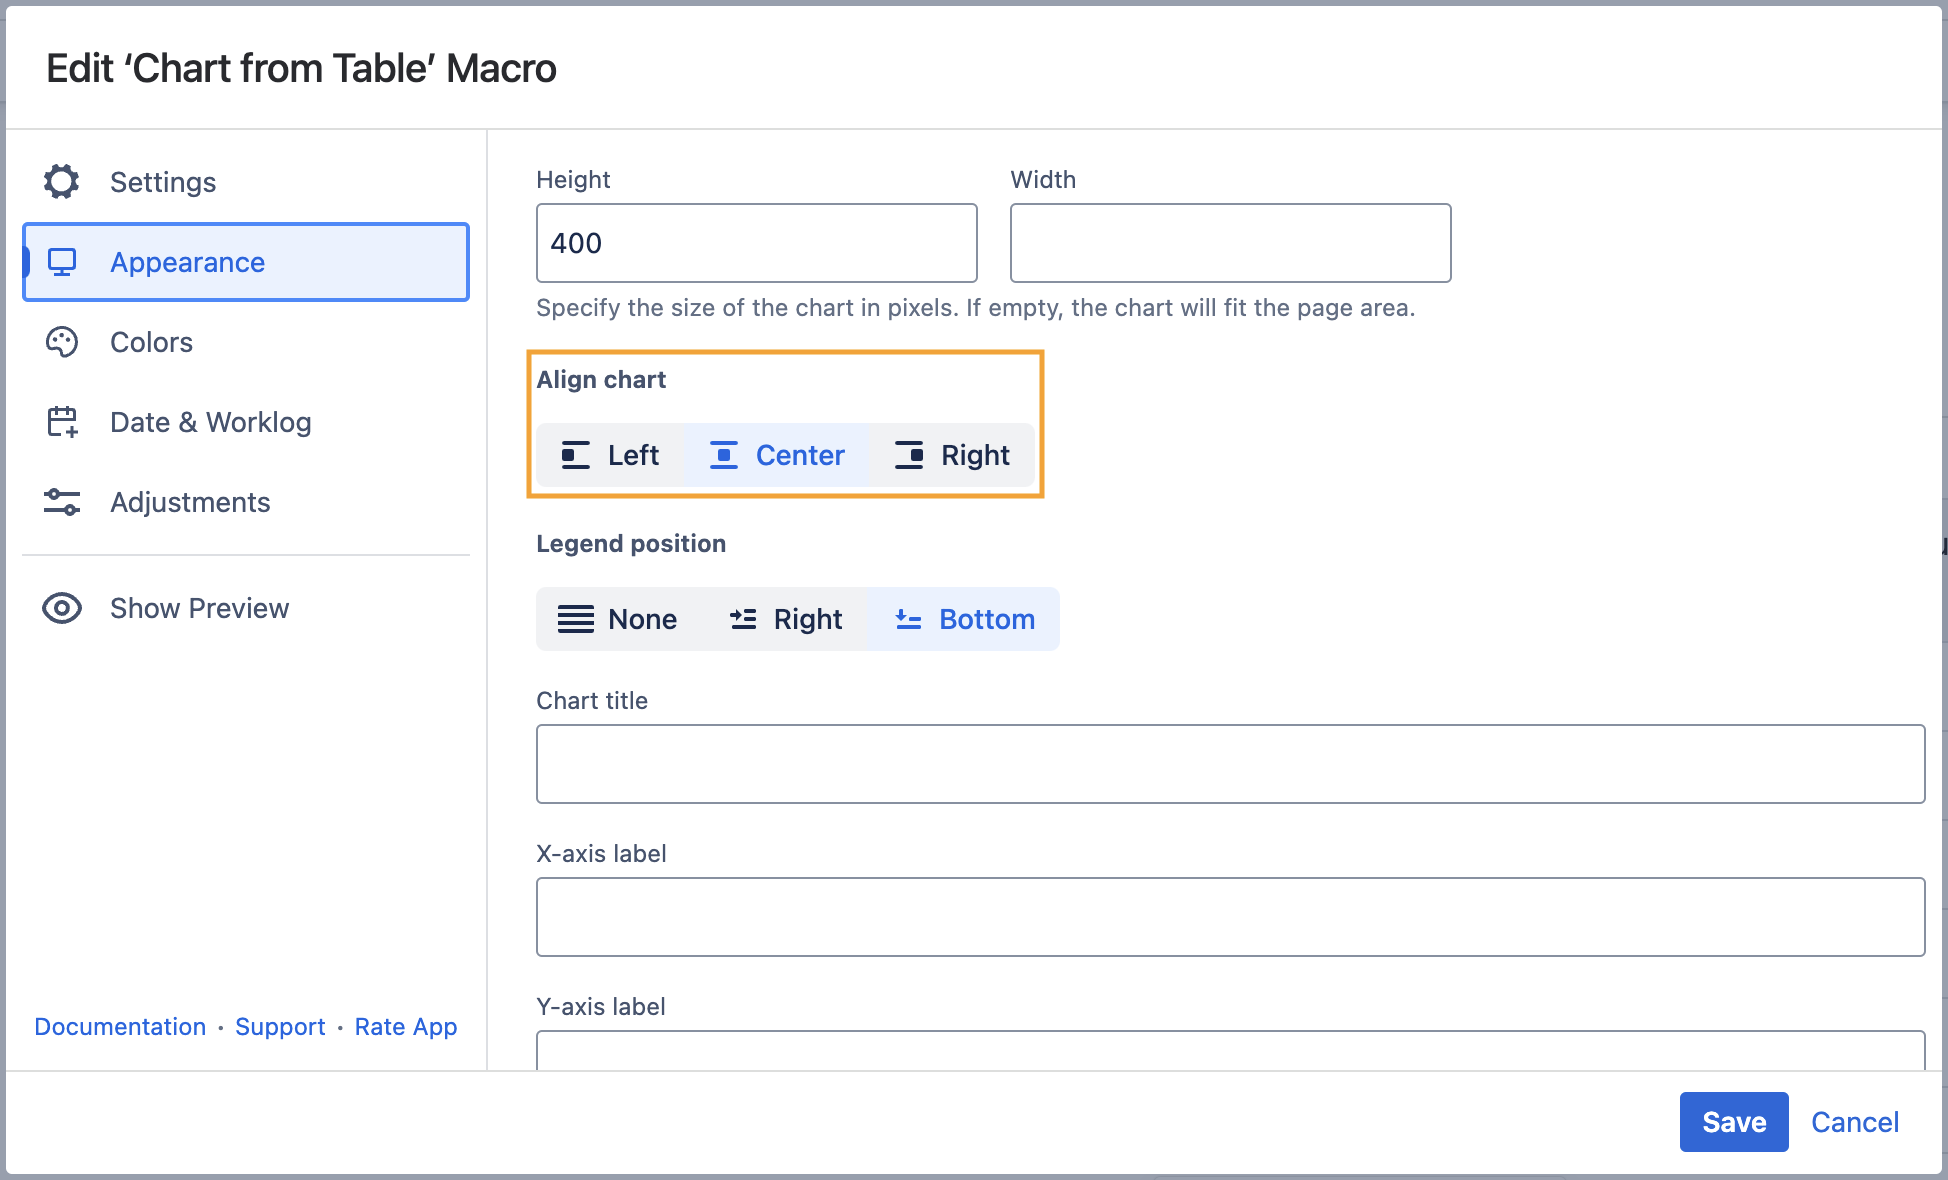
Align chart
- Switch the page to the edit mode.
- Select the macro and click Edit.
- Switch to the Appearance tab.
- Locate the Align chart option.
- Select the appropriate chart alignment, as follows:
- Left
- Center
- Right
- Save the macro and the page.
Set the legend position
- Switch the page to the edit mode.
- Select the macro and click Edit.
- Switch to the Appearance tab.
- Locate the Legend Position option.
- Select the appropriate legend position, as follows:
- None
- Right
- Bottom
- Save the macro and the page.
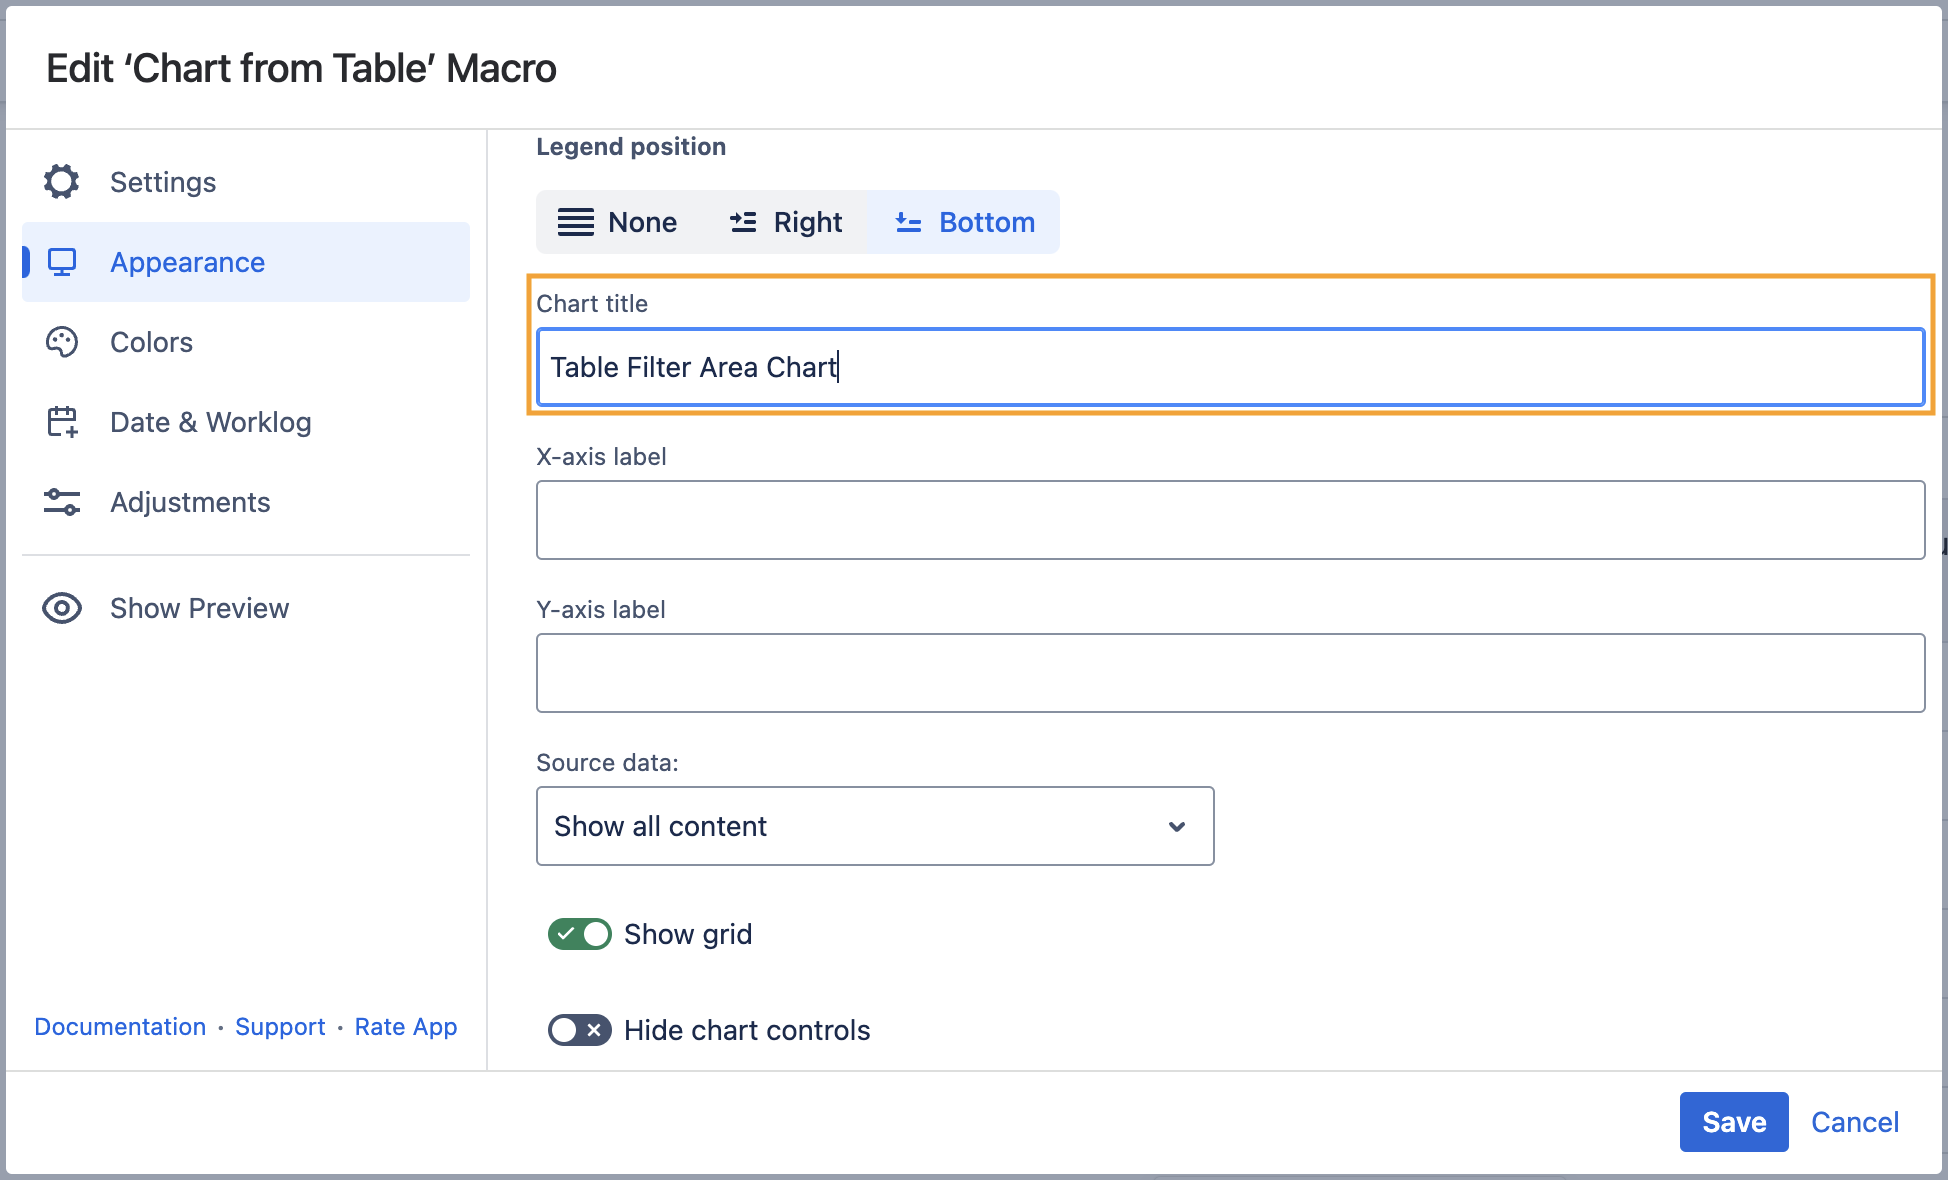
Set the chart title
- Switch the page to the edit mode.
- Select the macro and click Edit.
- Switch to the Appearance tab.
- Locate the Chart title option and enter the title.
- Save the macro and the page.
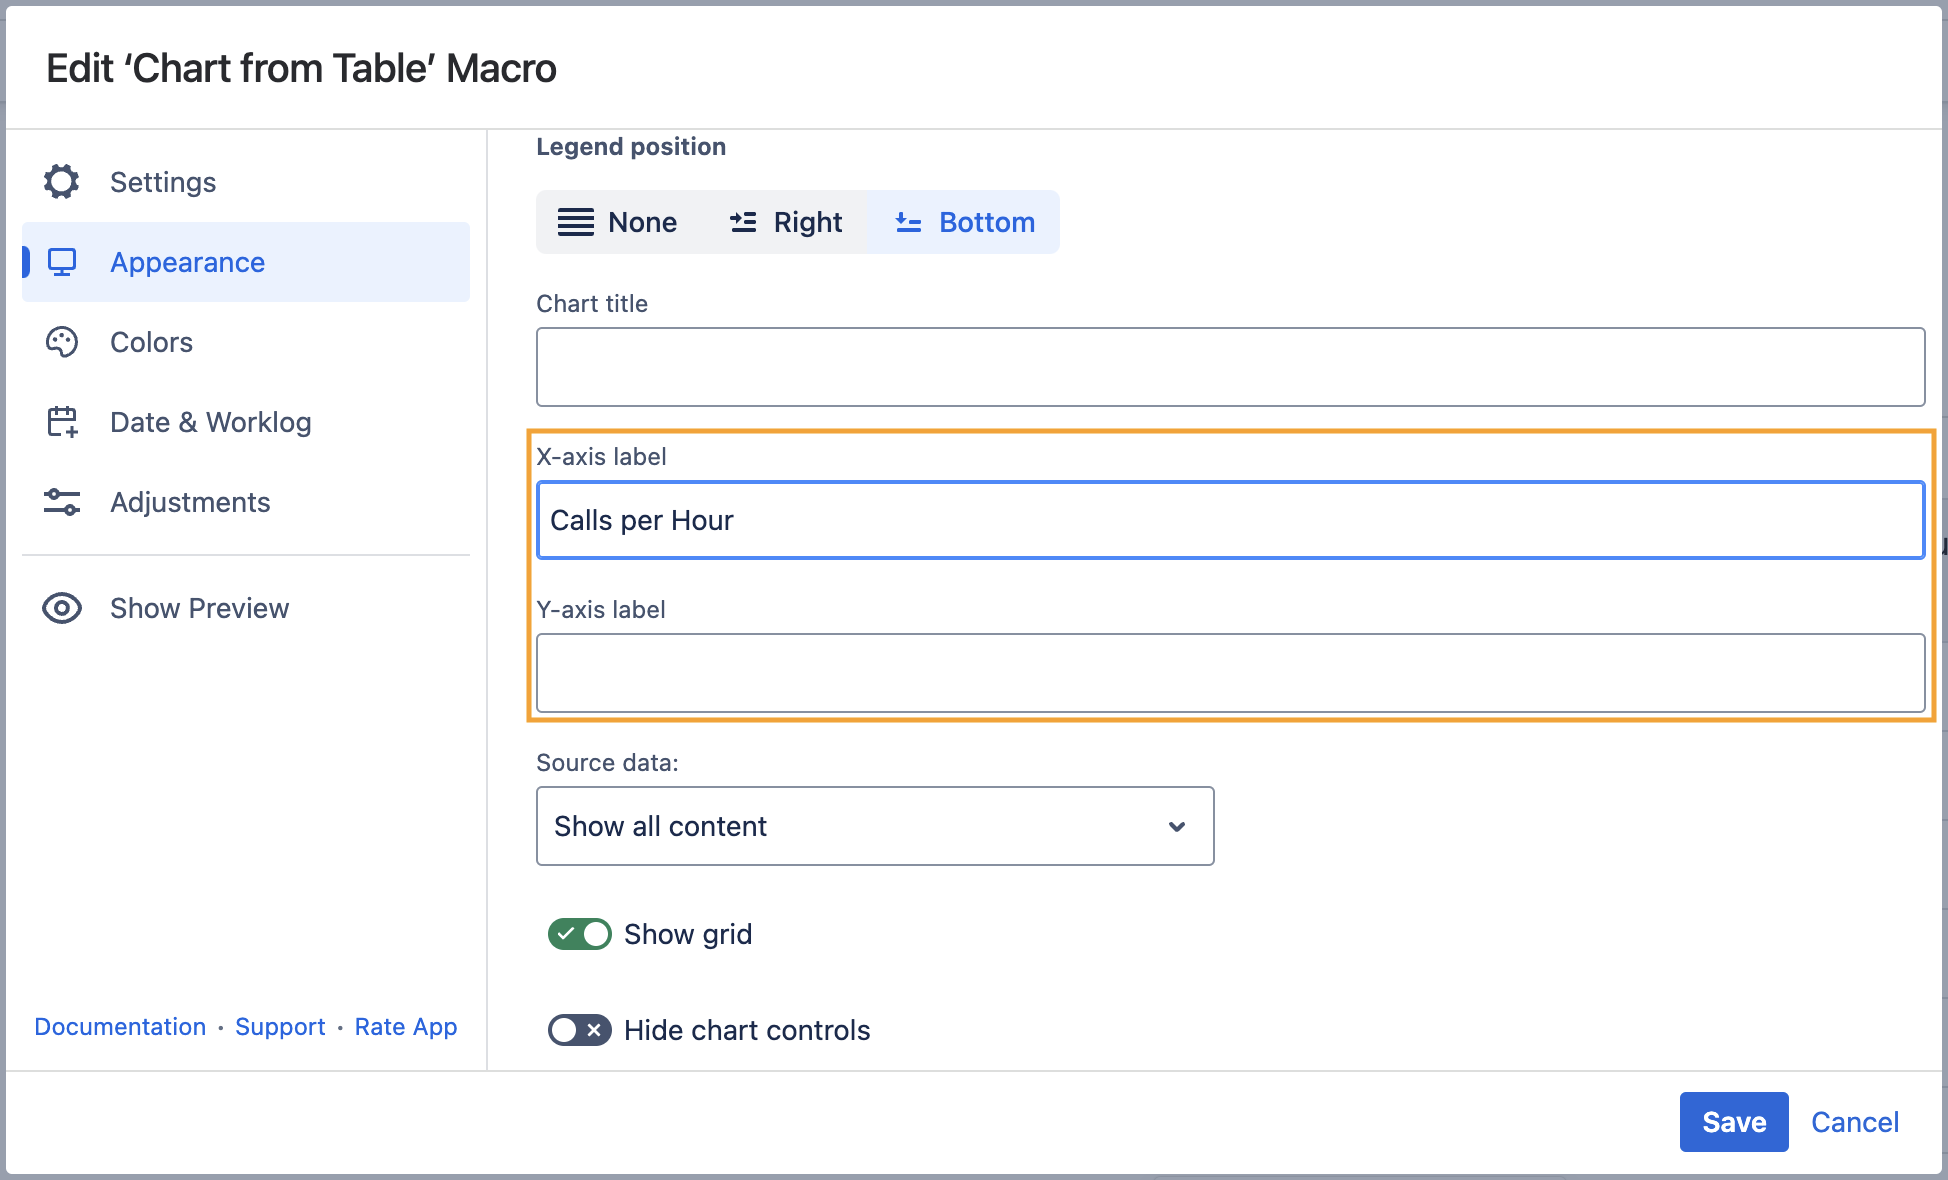
Set axis labels
- Switch the page to the edit mode.
- Select the macro and click Edit.
- Switch to the Appearance tab.
- Locate the X-axis label and Y-axis label options and enter the labels.
- Save the macro and the page.
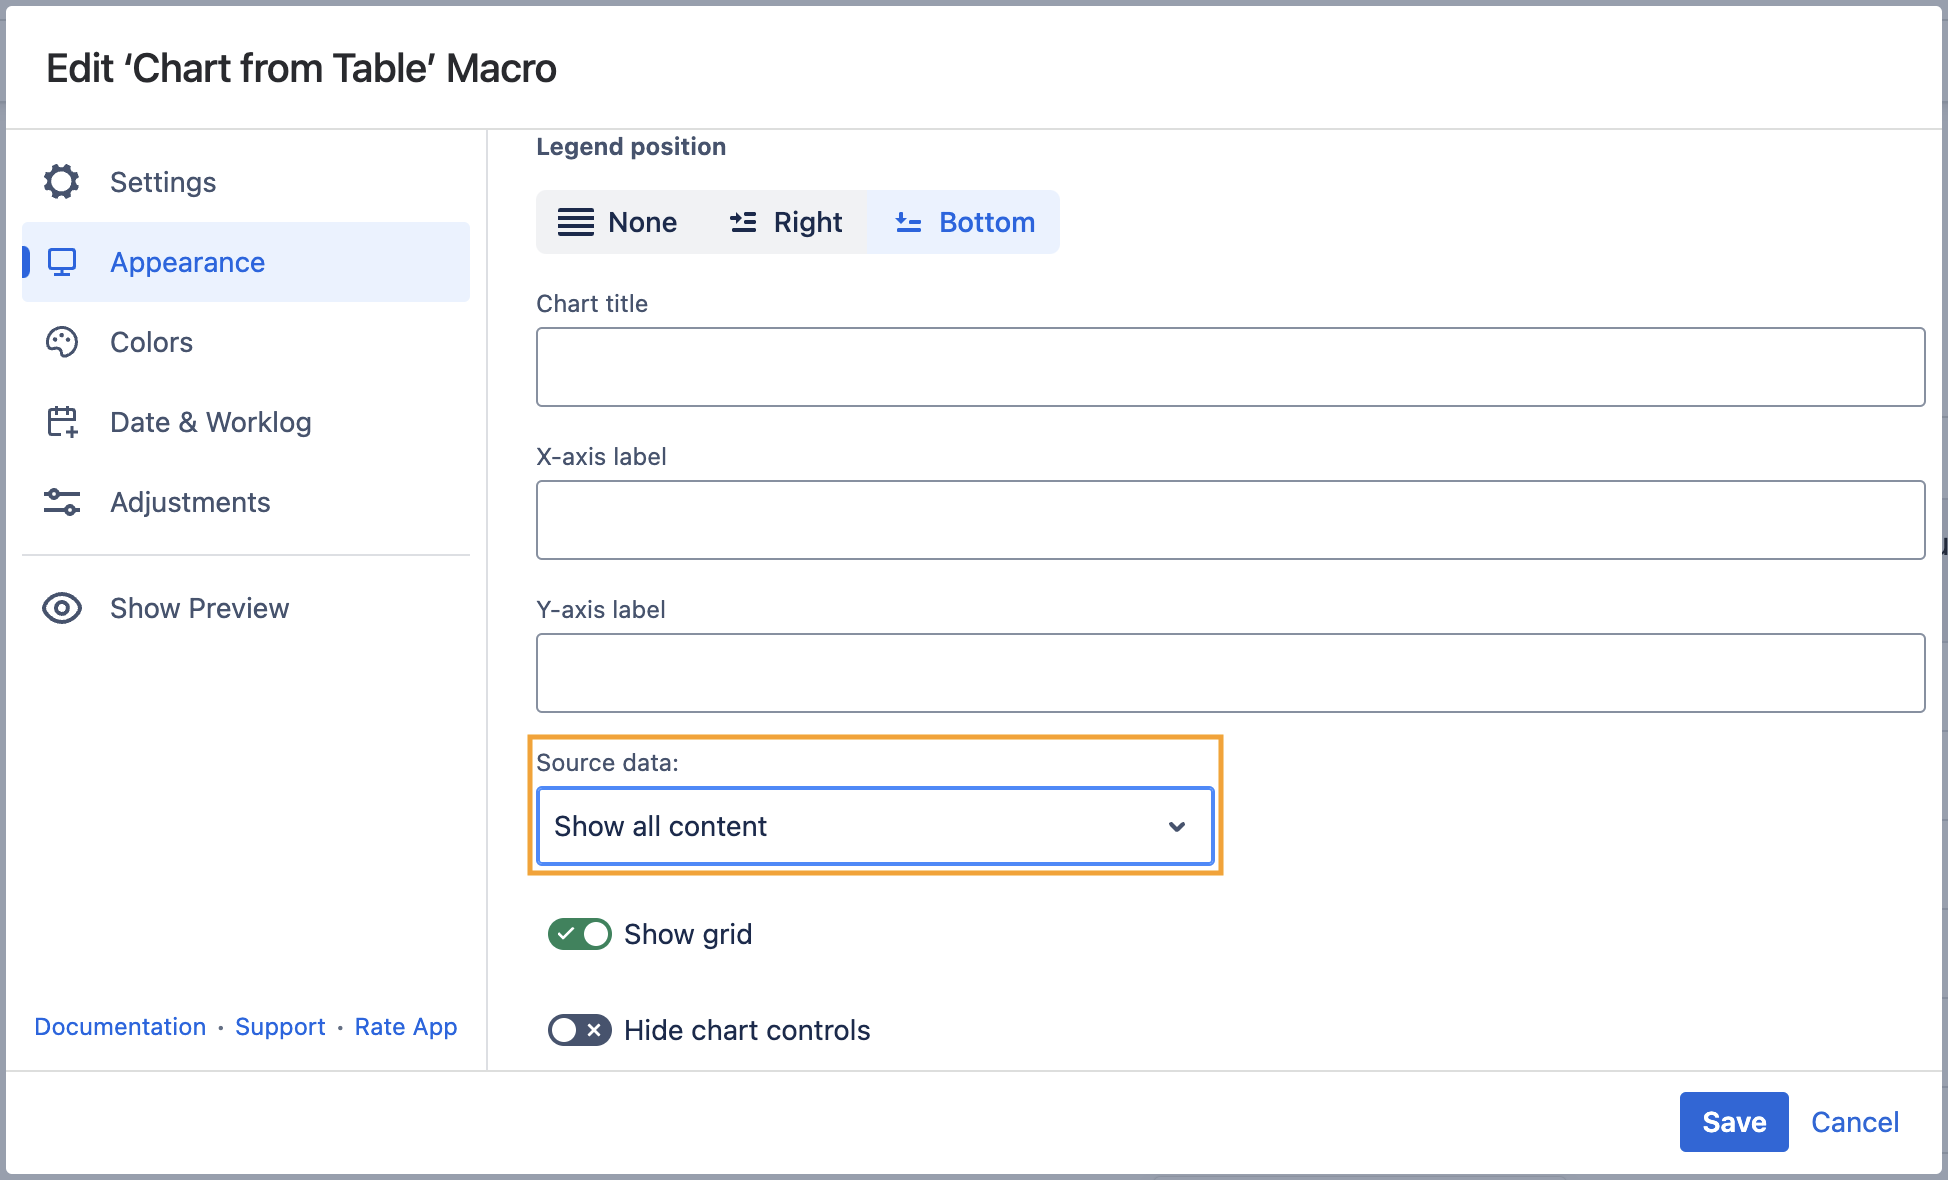
Show/Hide source data
- Switch the page to the edit mode.
- Select the macro and click Edit.
- Switch to the Appearance tab.
- Locate the Source data option and select the appropriate option, as follows:
- Show all content
- Hide tables
- Hide all content
- Save the macro and the page.
To show/hide source data in the page view mode:
- Hover over the chart controls on the right of the table.
- Click the cogwheel icon, select the Show source content, Hide source content (Hide tables, Hide all content) option.
- To save the modifications in the macro body, click the cogwheel icon and select Save changes.
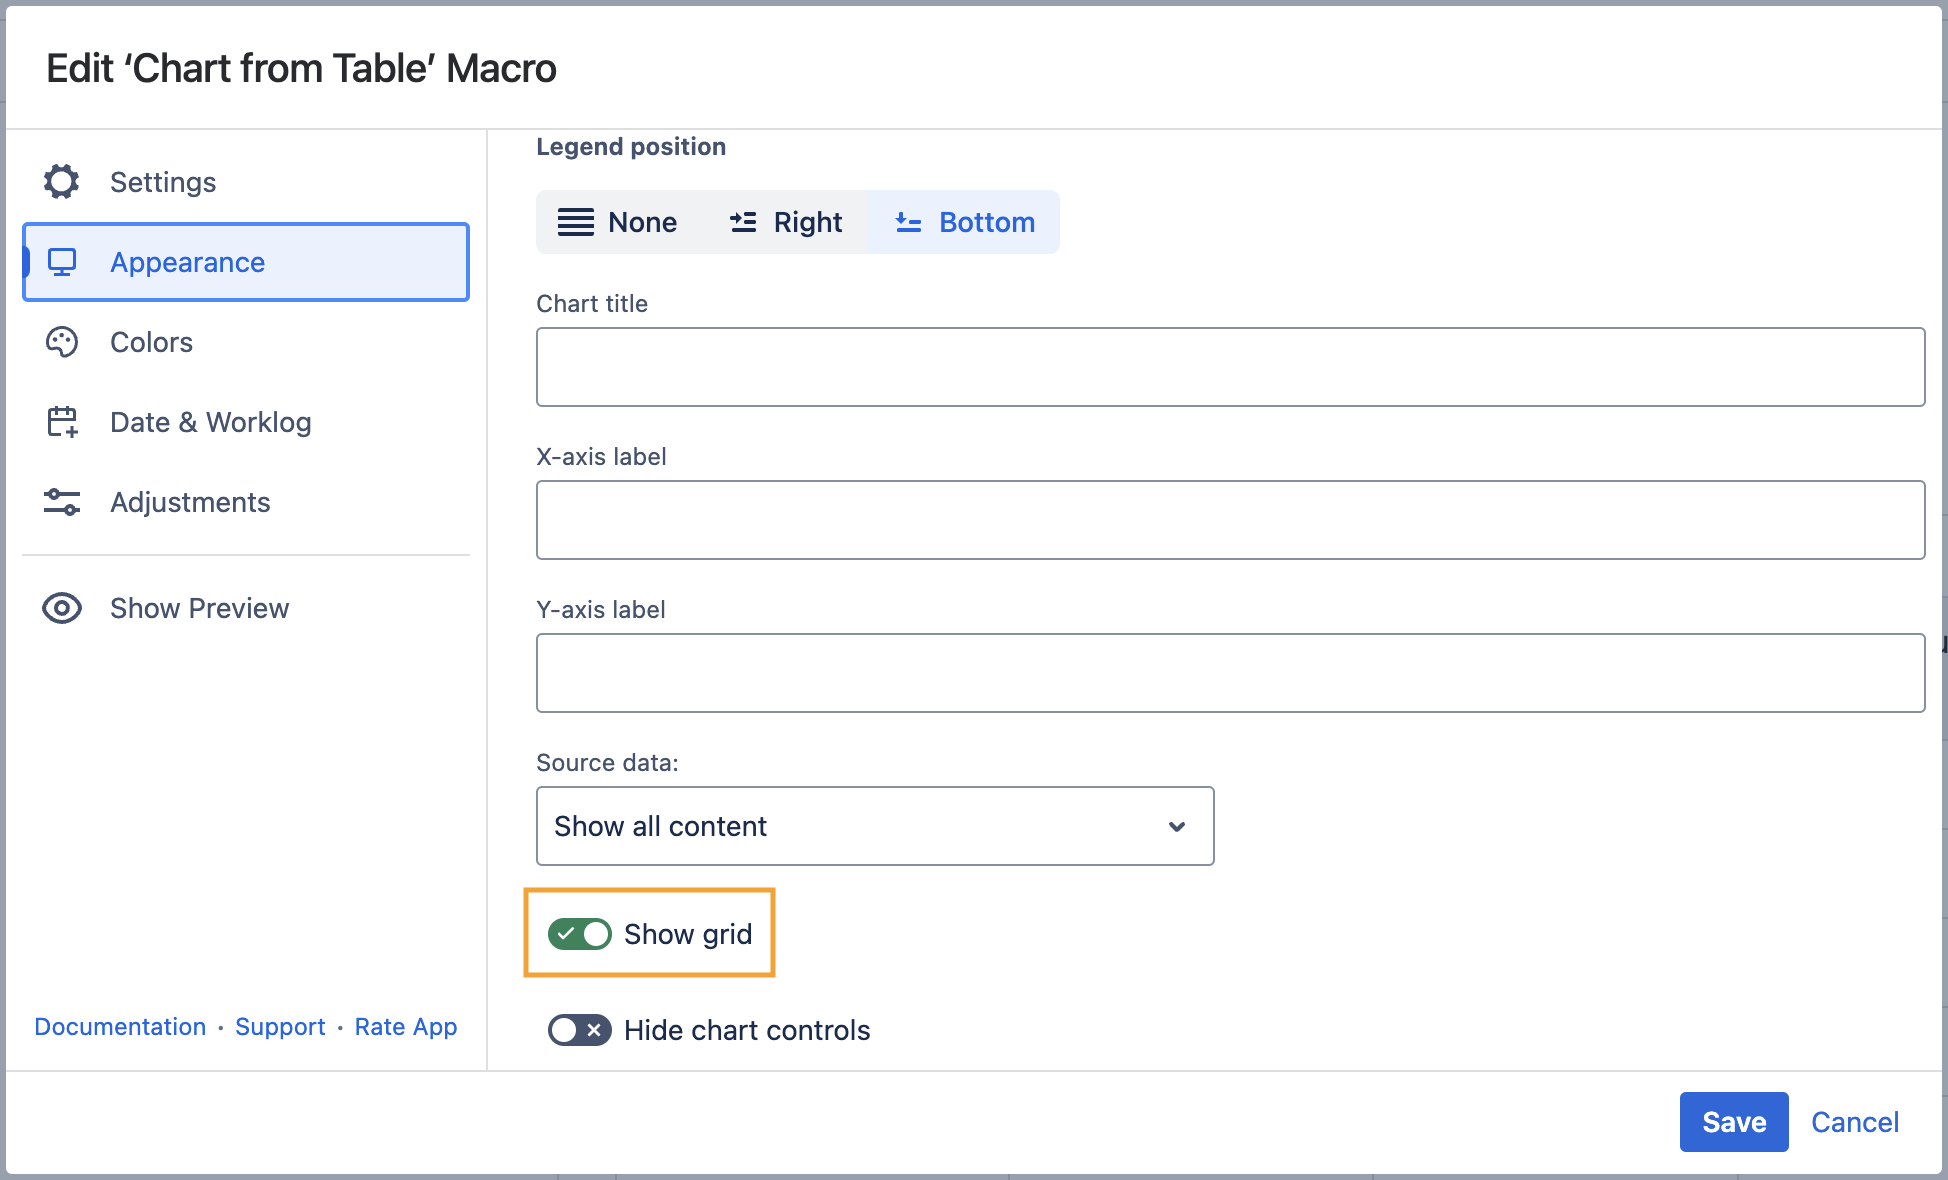
Show grid
- Switch the page to the edit mode.
- Select the macro and click Edit.
- Switch to the Appearance tab.
- Locate and enable the Show grid option.
- Save the macro and the page.
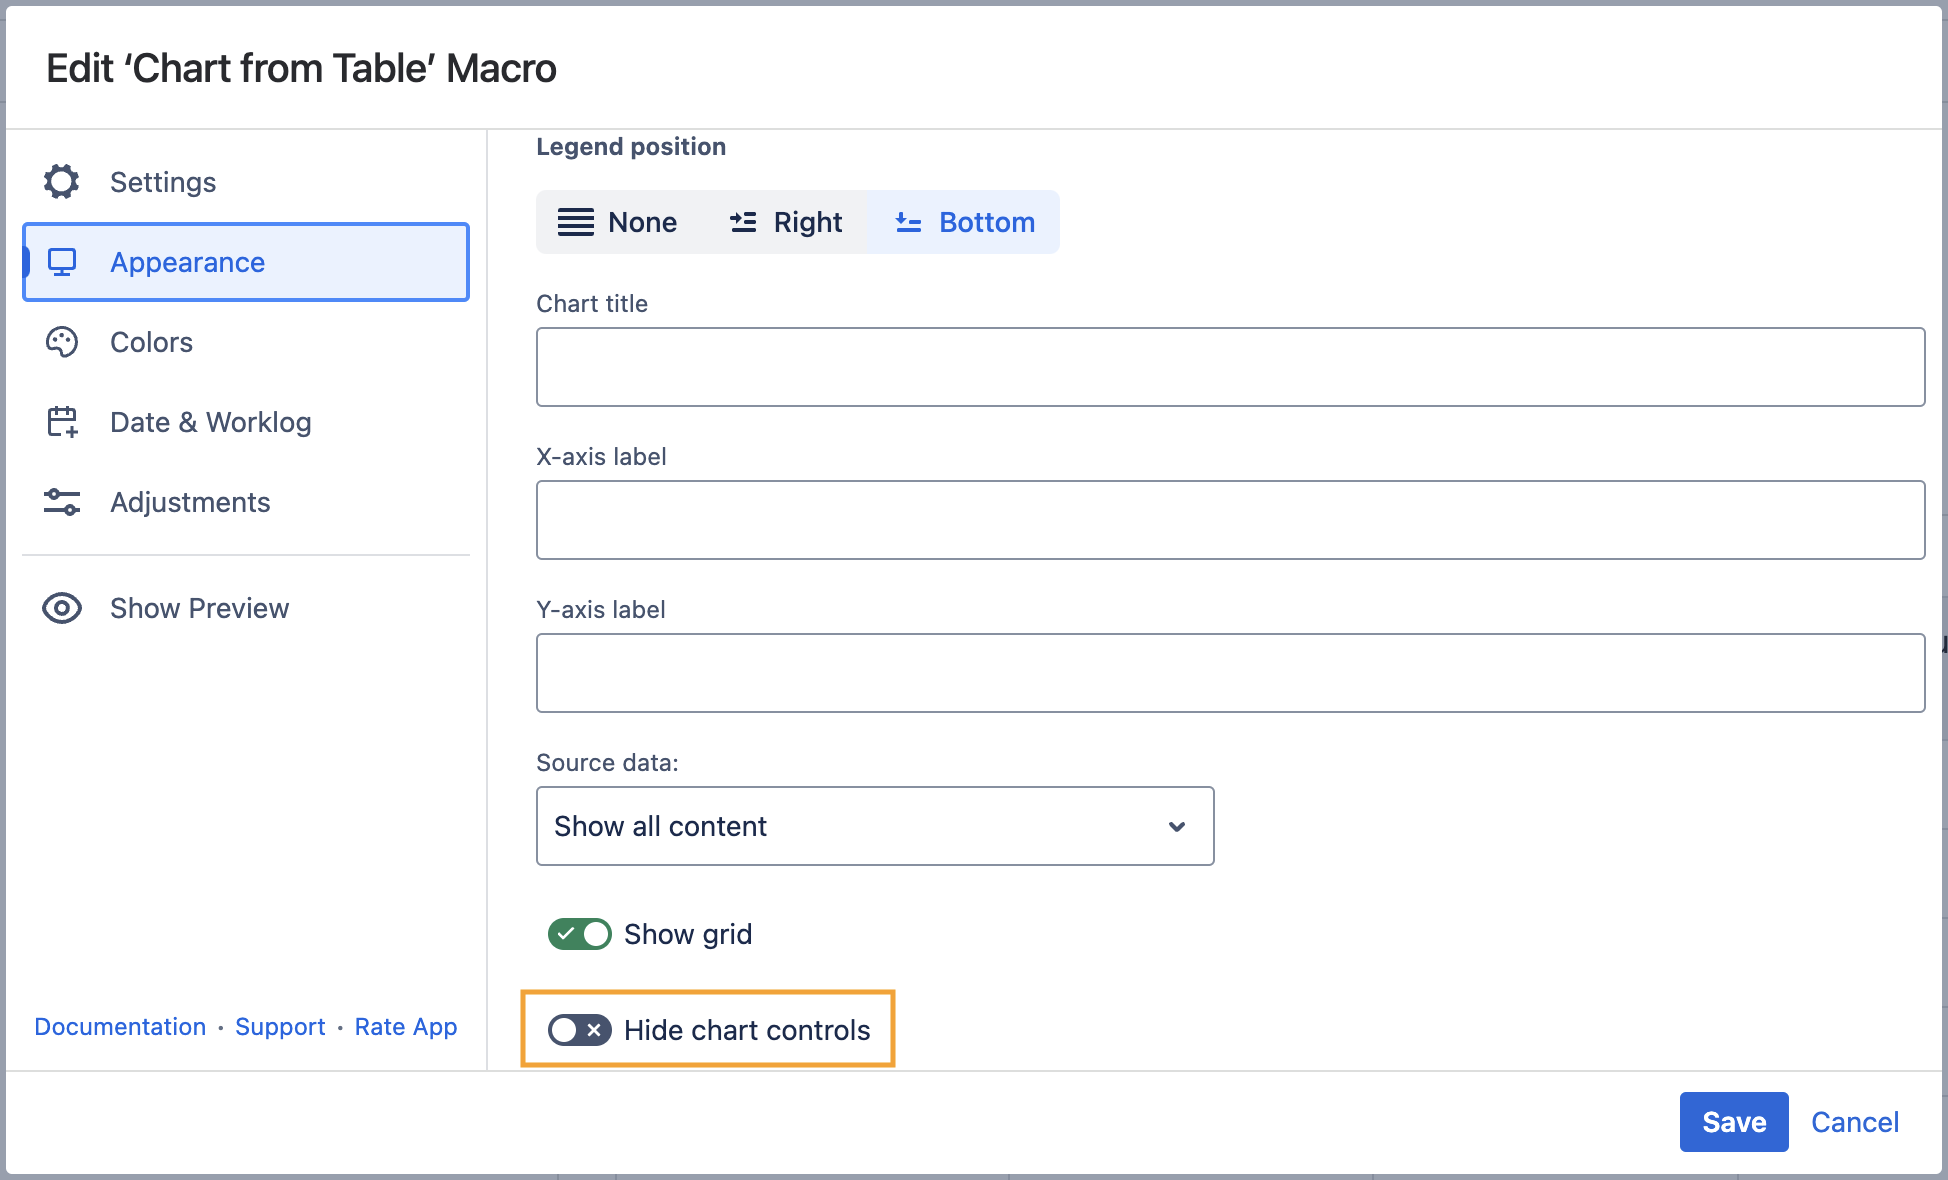
Hide chart controls
- Switch the page to the edit mode.
- Select the macro and click Edit.
- Switch to the Appearance tab.
- Locate and enable the Hide chart controls option.
- Save the macro and the page.
Colors Tab
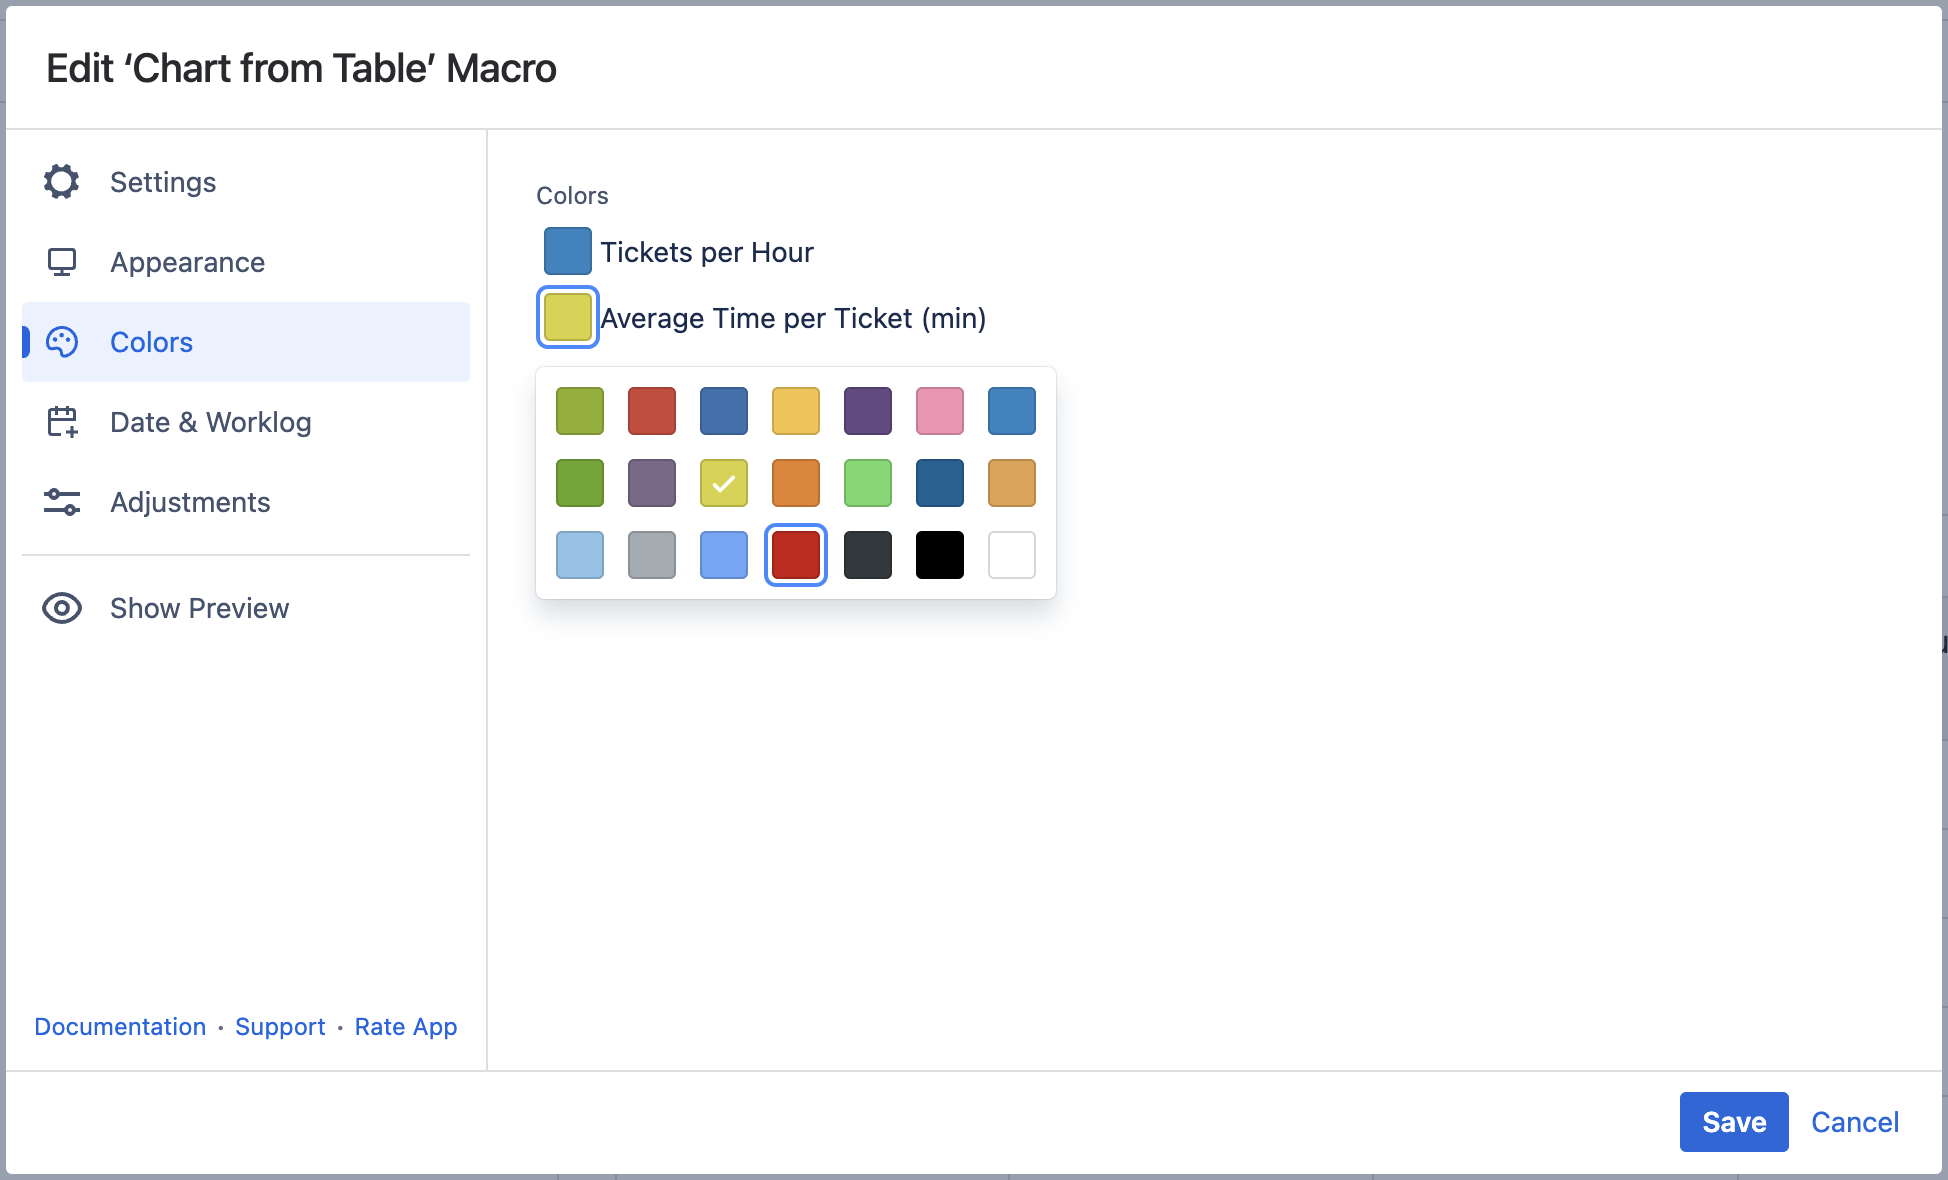
Set colors
- Switch the page to the edit mode.
- Select the macro and click Edit.
- Switch to the Colors tab.
- Select the appropriate colors for each label.
- Save the macro and the page.
To set the colors in the page view mode:
- Hover over the chart controls on the right of the table.
- Click the cogwheel icon, locate the Select colors option. After selecting colors click Save. The chart will be automatically regenerated.
- To save the modifications in the macro body, click the cogwheel icon and select Save changes.
Preview Option
While working in the edit mode, use the Show/hide preview option to adjust the required settings before saving the macro and publishing the page.
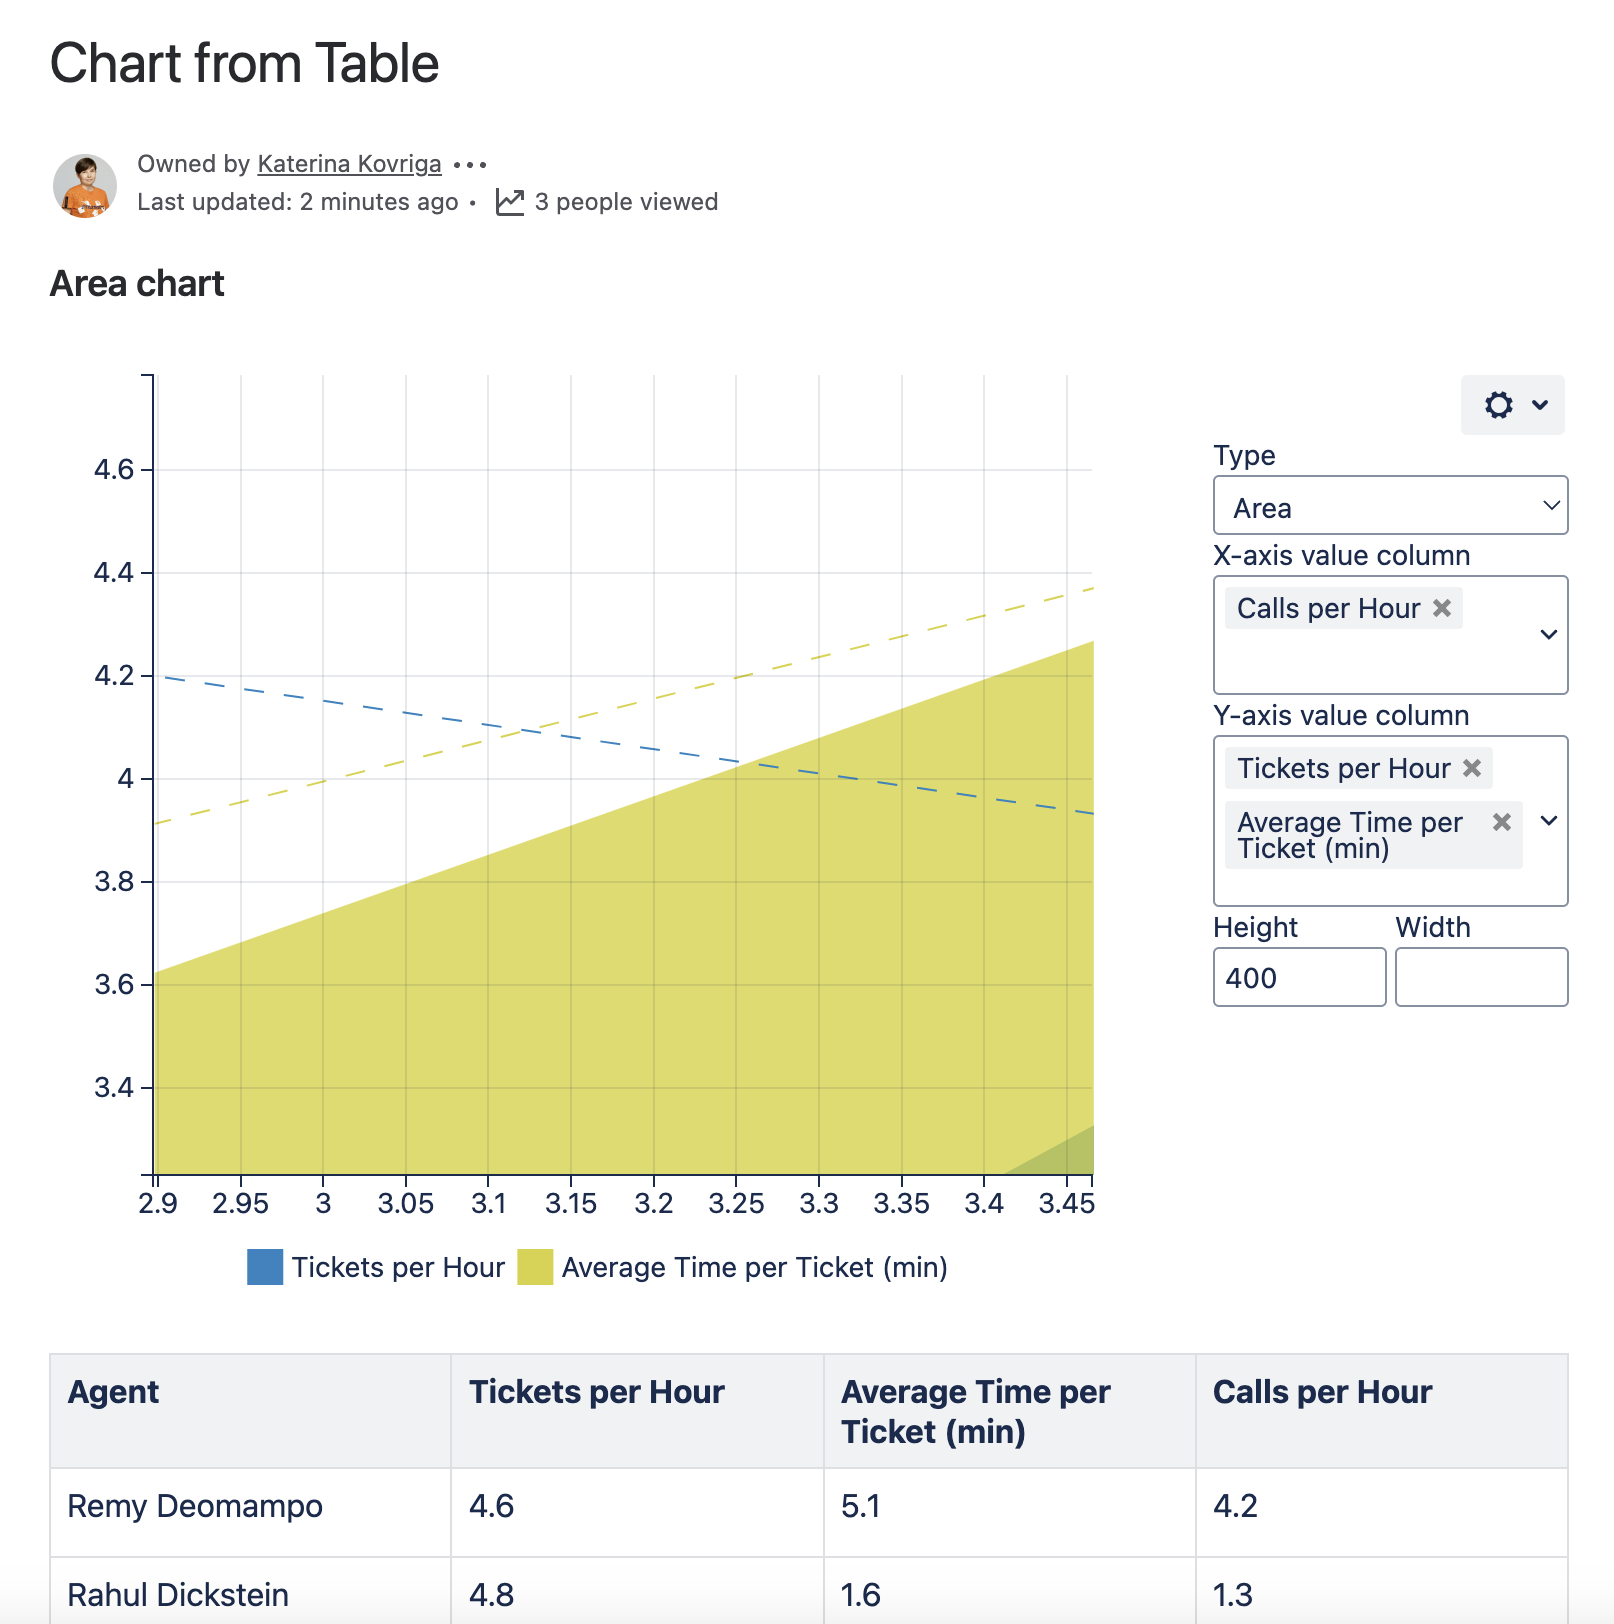
Zoom in Chart
- Open the page with the chart you want to zoom in.
- Hover your mouse pointer over this chart.
- Hold down Ctrl and rotate the wheel button forward to zoom in the chart.
You can also do the following:
To zoom in over the desired chart area:
- Click and hold the left mouse button.
- Drag the mouse pointer down and right over the chart.
To zoom out the chart:
- Click and hold down the left mouse button.
- Drag the mouse pointer left over the chart.
To scale up values along chart axes:
- Hold down Shift and drag the mouse pointer left or right. (for X axis)
- Hold down Shift and drag the mouse pointer upwards or downwards. (for Y axis)
To navigate across the chart:
- Hold down Ctrl (for Windows) or Alt (for MacOS) and drag the mouse pointer across the chart.